
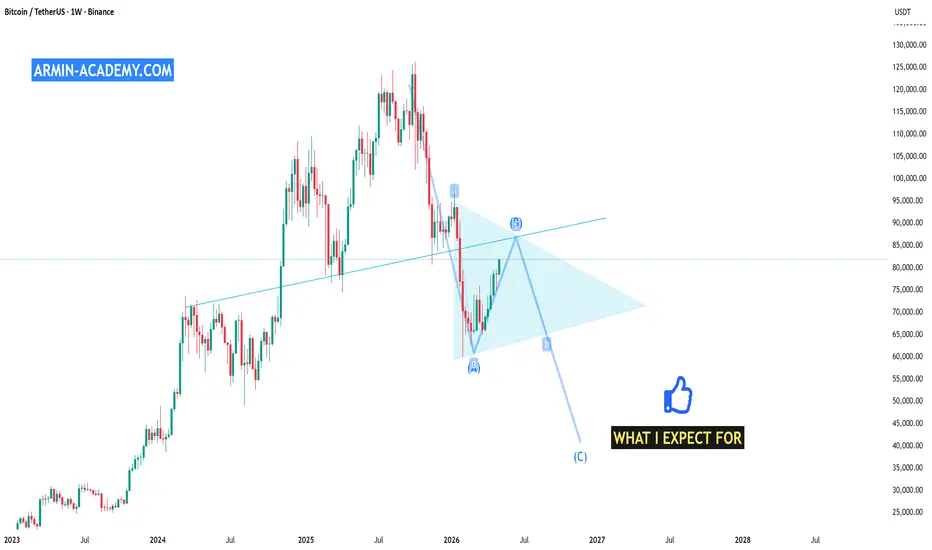
This chart shows my long‑term expectation for Bitcoin on the weekly timeframe.
The current structure suggests that BTC may be forming a broad corrective pattern, with key reaction zones marked as A, B, C, and D.
After the strong rally into the B region, the market is showing signs of exhaustion, and the overall structure hints at a potential deeper corrective leg before the next major expansion phase begins.
This doesn’t mean a crash is guaranteed — it simply reflects how price often behaves inside large harmonic or macro corrective formations.
For beginners, this chart helps visualize how markets move in waves, not in straight lines.
For advanced traders, the focus is on the reaction levels, liquidity zones, and the broader market cycle that may still need to cool down before continuation.
In short:
The long‑term trend remains bullish, but a healthy correction is still on the table.
🎓 Educational Note — Armin Academy
Markets don’t move in straight lines — they breathe.
Even in strong long‑term uptrends like Bitcoin’s macro cycle, price often forms large corrective waves to reset liquidity, sentiment, and momentum.
Understanding this rhythm helps traders avoid emotional decisions and focus on the bigger structure instead of every short‑term candle.
The key lesson:
When the chart looks the strongest, smart money often prepares for the next correction — and when the chart looks the weakest, they quietly accumulate.
Good luck!
Armin
The current structure suggests that BTC may be forming a broad corrective pattern, with key reaction zones marked as A, B, C, and D.
After the strong rally into the B region, the market is showing signs of exhaustion, and the overall structure hints at a potential deeper corrective leg before the next major expansion phase begins.
This doesn’t mean a crash is guaranteed — it simply reflects how price often behaves inside large harmonic or macro corrective formations.
For beginners, this chart helps visualize how markets move in waves, not in straight lines.
For advanced traders, the focus is on the reaction levels, liquidity zones, and the broader market cycle that may still need to cool down before continuation.
In short:
The long‑term trend remains bullish, but a healthy correction is still on the table.
🎓 Educational Note — Armin Academy
Markets don’t move in straight lines — they breathe.
Even in strong long‑term uptrends like Bitcoin’s macro cycle, price often forms large corrective waves to reset liquidity, sentiment, and momentum.
Understanding this rhythm helps traders avoid emotional decisions and focus on the bigger structure instead of every short‑term candle.
The key lesson:
When the chart looks the strongest, smart money often prepares for the next correction — and when the chart looks the weakest, they quietly accumulate.
Good luck!
Armin
액티브 트레이드
As expected, the next leg was created and we are in expansion wave C
면책사항
해당 정보와 게시물은 금융, 투자, 트레이딩 또는 기타 유형의 조언이나 권장 사항으로 간주되지 않으며, 트레이딩뷰에서 제공하거나 보증하는 것이 아닙니다. 자세한 내용은 이용 약관을 참조하세요.
면책사항
해당 정보와 게시물은 금융, 투자, 트레이딩 또는 기타 유형의 조언이나 권장 사항으로 간주되지 않으며, 트레이딩뷰에서 제공하거나 보증하는 것이 아닙니다. 자세한 내용은 이용 약관을 참조하세요.