
Hi guys,
Ascending Channel and Breakout:
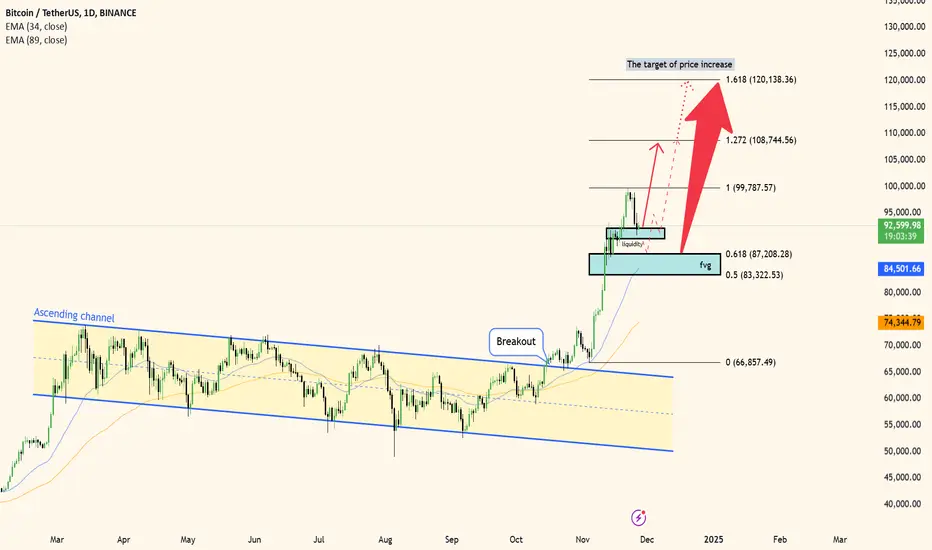
The chart shows a long-term ascending channel that guided price action for several months. Recently, Bitcoin broke out of this channel, signaling a strong shift in bullish momentum. The breakout was accompanied by significant volume, confirming the strength of the move.
Fibonacci Levels and Pullback Zone:
After the breakout, the price retraced slightly and is now hovering around the 0.618 Fibonacci retracement level ($87,208) and the 0.5 level ($83,322). This area is critical, as it coincides with a Fair Value Gap (FVG)—a liquidity zone where buyers are likely to step in.
EMA 34 and EMA 89 Support:
Both EMA 34 and EMA 89 are acting as dynamic support levels, and their upward slope reinforces the bullish structure. This alignment confirms that the current pullback is part of a healthy correction in a broader uptrend.
Liquidity Grab Potential:
The highlighted liquidity zone suggests that price may temporarily dip to attract more buyers. A test of this zone could serve as a springboard for the next upward leg.
Upside Targets:
Using Fibonacci extensions, my first target aligns with the 1.0 level ($99,787), followed by 1.272 ($108,744) and 1.618 ($120,138). These levels represent logical points where profit-taking could occur in the next bullish wave.
Price Action Scenario:
Based on the chart, I anticipate a potential bounce from the liquidity zone and FVG, leading to a continuation of the bullish trend. However, a failure to hold the $83,322 level could invalidate this setup and shift focus back to lower support zones.
Conclusion:
The technicals suggest that Bitcoin remains bullish as long as the key support at $83,322 holds. I'm closely watching price action in the FVG zone for signs of buying pressure before targeting higher levels at $99,787 and beyond. Patience is key, as the market digests the breakout and prepares for its next major move.
액티브 트레이드
good luck
면책사항
해당 정보와 게시물은 금융, 투자, 트레이딩 또는 기타 유형의 조언이나 권장 사항으로 간주되지 않으며, 트레이딩뷰에서 제공하거나 보증하는 것이 아닙니다. 자세한 내용은 이용 약관을 참조하세요.
면책사항
해당 정보와 게시물은 금융, 투자, 트레이딩 또는 기타 유형의 조언이나 권장 사항으로 간주되지 않으며, 트레이딩뷰에서 제공하거나 보증하는 것이 아닙니다. 자세한 내용은 이용 약관을 참조하세요.