
Hello friends, welcome to this BITCOIN update from Crypto Sanders.
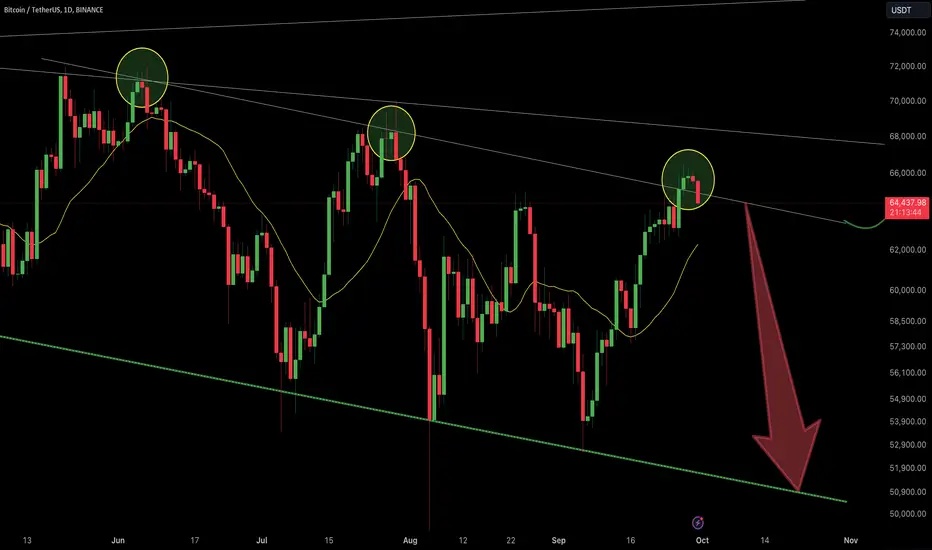
The chart shows Bitcoin getting rejected at a key resistance level, as indicated by three rounded peaks. The third peak, marked as the most recent, shows another failure to break the descending resistance trendline.
The red arrow indicates a potential bearish move, forecasting a decline in Bitcoin price towards the lower green trendline, which has been acting as a support level since June. This suggests a potential retest of support around the $50,000 – $52,000 level.
After nearly touching $66,000, Bitcoin has pulled back and is currently trading around $64,487. The price appears to have been rejected near the resistance area, which aligns with a previous pattern of failure to break out.
The yellow moving average line is sloping upwards, but the rejection at resistance suggests that the price may continue to struggle, which is in line with the bearish forecast in the short term.
Do you want more information on potential price movements or further interpretation of this chart?
Disclaimer: This analysis is for informational purposes and is not financial advice. Always stay updated with market movements and adjust your trading strategies as needed.

관련 발행물
면책사항
해당 정보와 게시물은 금융, 투자, 트레이딩 또는 기타 유형의 조언이나 권장 사항으로 간주되지 않으며, 트레이딩뷰에서 제공하거나 보증하는 것이 아닙니다. 자세한 내용은 이용 약관을 참조하세요.
관련 발행물
면책사항
해당 정보와 게시물은 금융, 투자, 트레이딩 또는 기타 유형의 조언이나 권장 사항으로 간주되지 않으며, 트레이딩뷰에서 제공하거나 보증하는 것이 아닙니다. 자세한 내용은 이용 약관을 참조하세요.