
BTC/USD
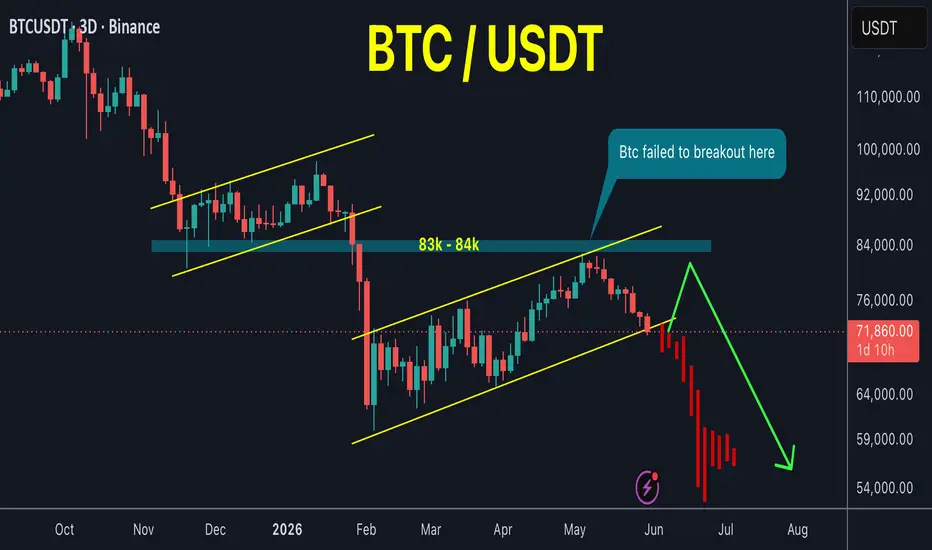
Bitcoin's price has formed another bearish flag pattern similar to the previous one.
Bitcoin has been trading within this bearish pattern for four months, and a break below it would likely lead to a price drop to a previous low or lower.
Since the top in October , the price appears to have failed to make any bullish break out, suggesting that Bitcoin will continue to decline more sooner or later until there is real trend shift in market structure
Scenario 1 and 2 both bearish now in my chart
Bitcoin's price has formed another bearish flag pattern similar to the previous one.
Bitcoin has been trading within this bearish pattern for four months, and a break below it would likely lead to a price drop to a previous low or lower.
Since the top in October , the price appears to have failed to make any bullish break out, suggesting that Bitcoin will continue to decline more sooner or later until there is real trend shift in market structure
Scenario 1 and 2 both bearish now in my chart
액티브 트레이드
BTC just hit 68k ☑️거래청산: 타겟 닿음
The price dropped sharply a few hours after my analysis. 노트
Update :노트
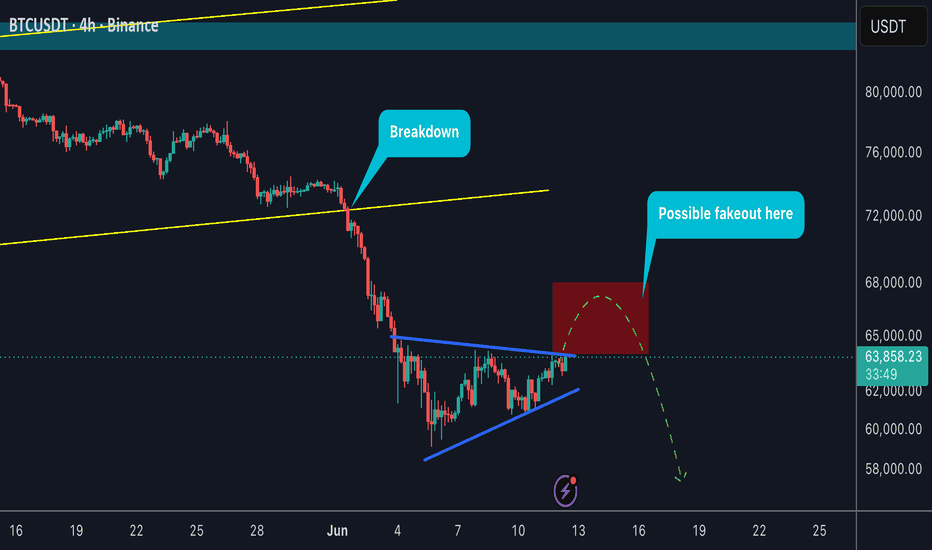
Bitcoin reached $60,000 for the first time after four months of accumulation within this bearish pattern, as I predicted in my analysis.노트
New update released For full details Check here : 👇

🔷 Telegram channel: t.me/bitcoin_masters
💸☎️ For Premium Signals Group ask me here: t.me/Babenski
💸☎️ For Premium Signals Group ask me here: t.me/Babenski
관련 발행물
면책사항
해당 정보와 게시물은 금융, 투자, 트레이딩 또는 기타 유형의 조언이나 권장 사항으로 간주되지 않으며, 트레이딩뷰에서 제공하거나 보증하는 것이 아닙니다. 자세한 내용은 이용 약관을 참조하세요.
🔷 Telegram channel: t.me/bitcoin_masters
💸☎️ For Premium Signals Group ask me here: t.me/Babenski
💸☎️ For Premium Signals Group ask me here: t.me/Babenski
관련 발행물
면책사항
해당 정보와 게시물은 금융, 투자, 트레이딩 또는 기타 유형의 조언이나 권장 사항으로 간주되지 않으며, 트레이딩뷰에서 제공하거나 보증하는 것이 아닙니다. 자세한 내용은 이용 약관을 참조하세요.