
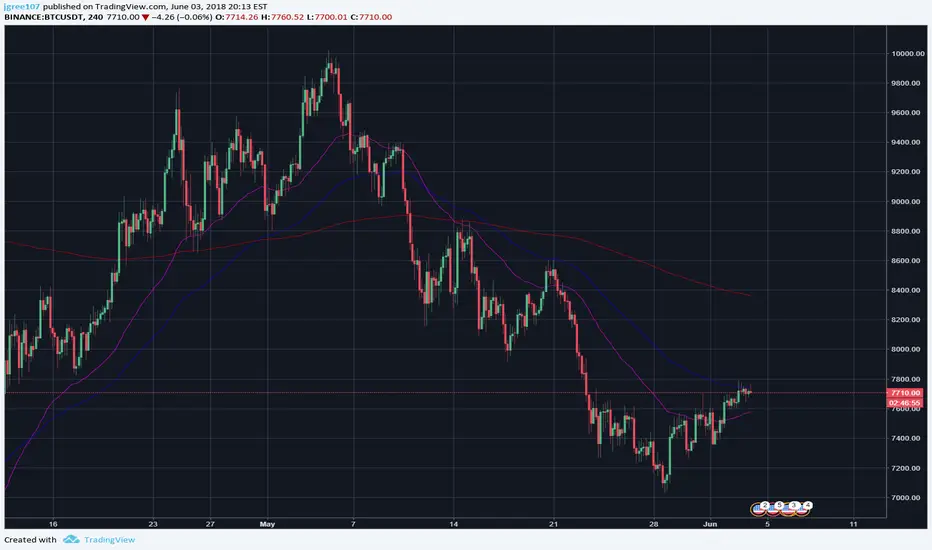
As you can see, BTC seems to have found a bottom and is working it's way upward.
Having already breached the SMA 25 (4H) chart, it is hovering over the SMA 50. This, is still short (by around $700) of a cross of the SMA 200. This barrier has been a tough one for BTC to break but, if broken soon, could lead to a lot of optimism in the space.
Until the SMA 50 is broken is a serious manner, I will still remain hesitant. There are many traders on this site who have some incredible technical tools and use this to their advantage, I prefer to keep everything much more simple.
-- Legend --
SMA 25 - Purple
SMA 50 - Blue
SMA 200 Red
Having already breached the SMA 25 (4H) chart, it is hovering over the SMA 50. This, is still short (by around $700) of a cross of the SMA 200. This barrier has been a tough one for BTC to break but, if broken soon, could lead to a lot of optimism in the space.
Until the SMA 50 is broken is a serious manner, I will still remain hesitant. There are many traders on this site who have some incredible technical tools and use this to their advantage, I prefer to keep everything much more simple.
-- Legend --
SMA 25 - Purple
SMA 50 - Blue
SMA 200 Red
노트
BTC bounced off of the SMA 50; this could lead to downward pressure. As mentioned above, if there is no serious breach of this level it could be very difficult to see upward movement.
면책사항
해당 정보와 게시물은 금융, 투자, 트레이딩 또는 기타 유형의 조언이나 권장 사항으로 간주되지 않으며, 트레이딩뷰에서 제공하거나 보증하는 것이 아닙니다. 자세한 내용은 이용 약관을 참조하세요.
면책사항
해당 정보와 게시물은 금융, 투자, 트레이딩 또는 기타 유형의 조언이나 권장 사항으로 간주되지 않으며, 트레이딩뷰에서 제공하거나 보증하는 것이 아닙니다. 자세한 내용은 이용 약관을 참조하세요.