
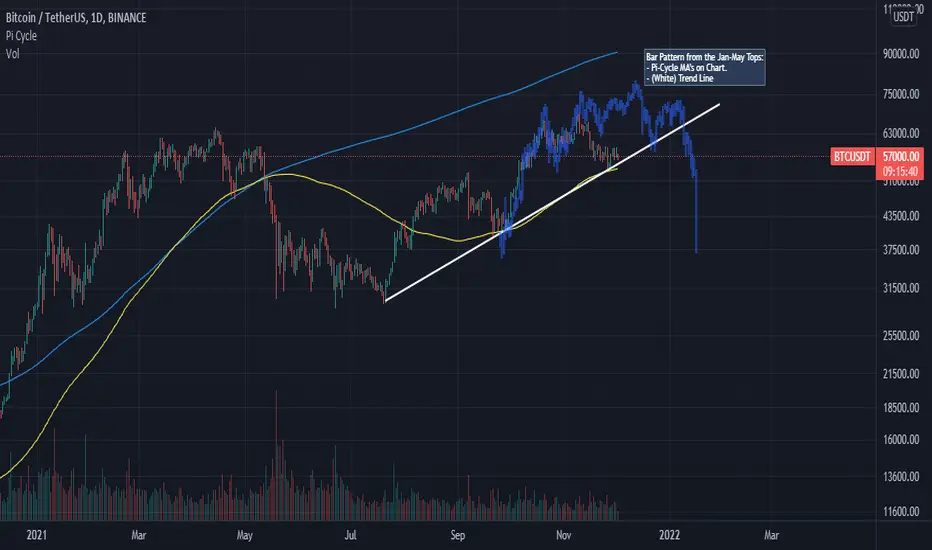
A bar pattern of the Jan-May higher high's has been taken and over-layed the current structure. The DMA's are the Pi-Cycle top model (top is a moving avg of 350*2, bottom is a 111 day MA) have served as critical lines of resistance and support.
What am I watching?
- First, the bar pattern is clearly similar, however, less explosive. (Less buying power and investor impetus).
- In order to stage a leg to the downside, we must complete the LH from a top and break the 111DMA.
- Trend Line has to be broken.
- Lastly, strong sell volume can be appreciated during a top, followed by weak buying volume the following top.
Just my .02
Cheers

면책사항
해당 정보와 게시물은 금융, 투자, 트레이딩 또는 기타 유형의 조언이나 권장 사항으로 간주되지 않으며, 트레이딩뷰에서 제공하거나 보증하는 것이 아닙니다. 자세한 내용은 이용 약관을 참조하세요.
면책사항
해당 정보와 게시물은 금융, 투자, 트레이딩 또는 기타 유형의 조언이나 권장 사항으로 간주되지 않으며, 트레이딩뷰에서 제공하거나 보증하는 것이 아닙니다. 자세한 내용은 이용 약관을 참조하세요.