
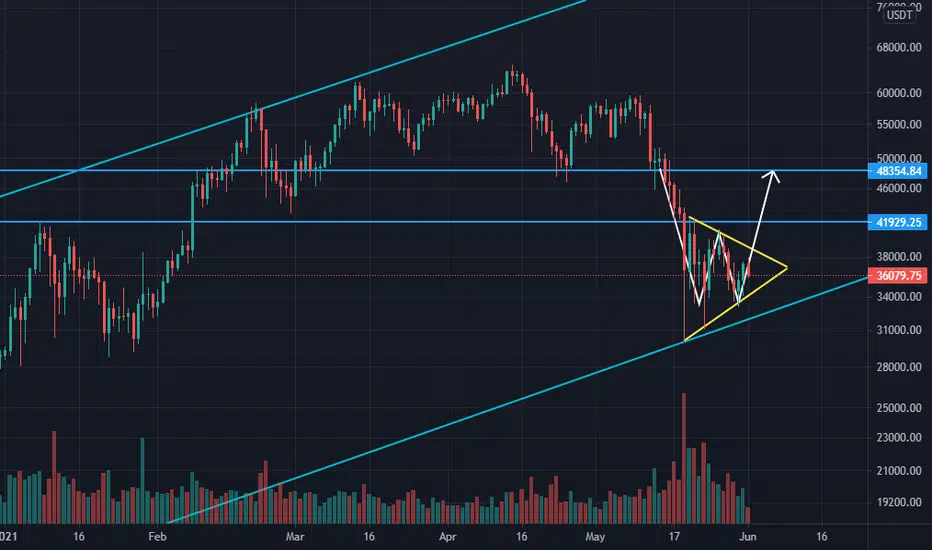
A double bottom is happening on BTCUSDT chart, It is not completed yet
Also we can see a triangle, If price breaks through the top line of the triangle then we can see also that double bottom pattern is working.
When BTC wants to break some price level, it breaks it in fast movement
You can see the targets on chart
Also:
- A double bottom is happening in Total Market Cap
- A double Top is happening in USDT Dominance
None of them are completed yet but I think it will.
" I can see a big head and shoulders too but I think it does not happen, Not now with the fact we have, Not if the supports are not lost. "
Also we can see a triangle, If price breaks through the top line of the triangle then we can see also that double bottom pattern is working.
When BTC wants to break some price level, it breaks it in fast movement
You can see the targets on chart
Also:
- A double bottom is happening in Total Market Cap
- A double Top is happening in USDT Dominance
None of them are completed yet but I think it will.
" I can see a big head and shoulders too but I think it does not happen, Not now with the fact we have, Not if the supports are not lost. "
노트
A double bottom is happening on ETHUSDT, We can see bullish signals in whole market노트
Price breaks through the bottom line of the triangle, A double Top happened and it broke its neck line
관련 발행물
면책사항
해당 정보와 게시물은 금융, 투자, 트레이딩 또는 기타 유형의 조언이나 권장 사항으로 간주되지 않으며, 트레이딩뷰에서 제공하거나 보증하는 것이 아닙니다. 자세한 내용은 이용 약관을 참조하세요.
면책사항
해당 정보와 게시물은 금융, 투자, 트레이딩 또는 기타 유형의 조언이나 권장 사항으로 간주되지 않으며, 트레이딩뷰에서 제공하거나 보증하는 것이 아닙니다. 자세한 내용은 이용 약관을 참조하세요.