
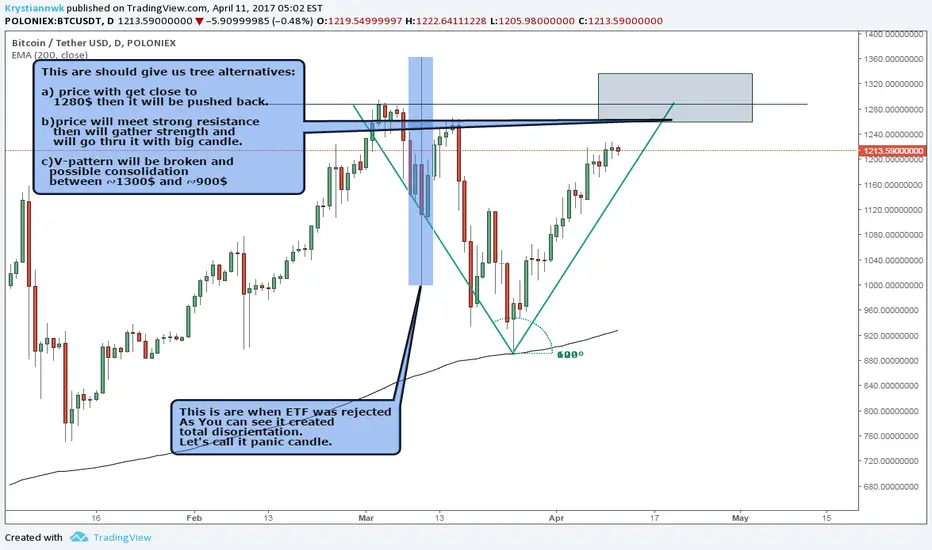
It is hard for me to predict where BTC could go in next weeks or months. I tried to apply known to me technicals but recent movements don’t fit to any of them. I found just one which could be used for “predictions” and it is called V-Pattern. I placed it on the chart(two rays deviated 60 degrees) . This pattern gives us place where we could see some interesting price action. It is marked with blue rectangle.
Fact that 200 Ema pushed price higher with ease above 1000$ mark makes me think that the bullish mode for BTC is still in play.
It is just a thought and it shouldn't be treated as trading advise
Fact that 200 Ema pushed price higher with ease above 1000$ mark makes me think that the bullish mode for BTC is still in play.
It is just a thought and it shouldn't be treated as trading advise

면책사항
해당 정보와 게시물은 금융, 투자, 트레이딩 또는 기타 유형의 조언이나 권장 사항으로 간주되지 않으며, 트레이딩뷰에서 제공하거나 보증하는 것이 아닙니다. 자세한 내용은 이용 약관을 참조하세요.
면책사항
해당 정보와 게시물은 금융, 투자, 트레이딩 또는 기타 유형의 조언이나 권장 사항으로 간주되지 않으며, 트레이딩뷰에서 제공하거나 보증하는 것이 아닙니다. 자세한 내용은 이용 약관을 참조하세요.