
Hello my dear friends
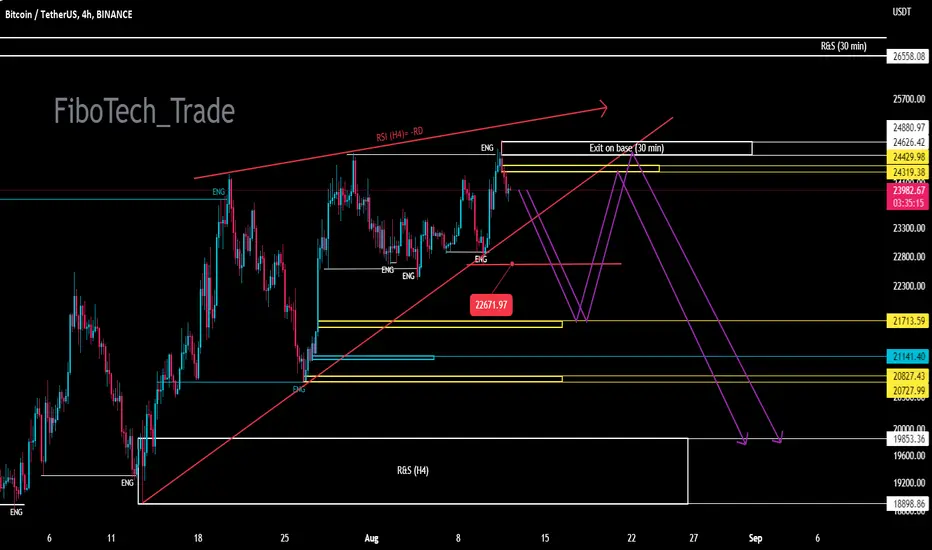
In your opinion, how valid is the drawn pattern?!?!?
We will not have the mindset to form a bearish trend until the corrective trend is below the $22,671.97 price range.
Don't forget the marked white and yellow ranges ($24,319 & $24,626) are valid after the $22,671.97 price range is fully consumed!
We would be happy to hear your comments.
In your opinion, how valid is the drawn pattern?!?!?
We will not have the mindset to form a bearish trend until the corrective trend is below the $22,671.97 price range.
Don't forget the marked white and yellow ranges ($24,319 & $24,626) are valid after the $22,671.97 price range is fully consumed!
We would be happy to hear your comments.
액티브 트레이드
It has activated all the higher areas!For now, no signal has been issued to continue the upward trend!!!
These increasing trends seem to be more to activate the limit of losses and collect the necessary liquidity for strange downward movements):
액티브 트레이드
The downward trend line was broken and a lower price floor was formed. So, the first approval for changing the process was issued.
Now we have to keep in mind that this morning we have a candle with a shadow from above.
The shadow of the candlestick shows us that there is a high probability of forming an upward trend and reacting to the yellow area ($24993.66). But we have to check depending on the type of the current trend, the downward trend will continue from the yellow area to what area!
거래청산: 타겟 닿음

면책사항
해당 정보와 게시물은 금융, 투자, 트레이딩 또는 기타 유형의 조언이나 권장 사항으로 간주되지 않으며, 트레이딩뷰에서 제공하거나 보증하는 것이 아닙니다. 자세한 내용은 이용 약관을 참조하세요.
면책사항
해당 정보와 게시물은 금융, 투자, 트레이딩 또는 기타 유형의 조언이나 권장 사항으로 간주되지 않으며, 트레이딩뷰에서 제공하거나 보증하는 것이 아닙니다. 자세한 내용은 이용 약관을 참조하세요.