
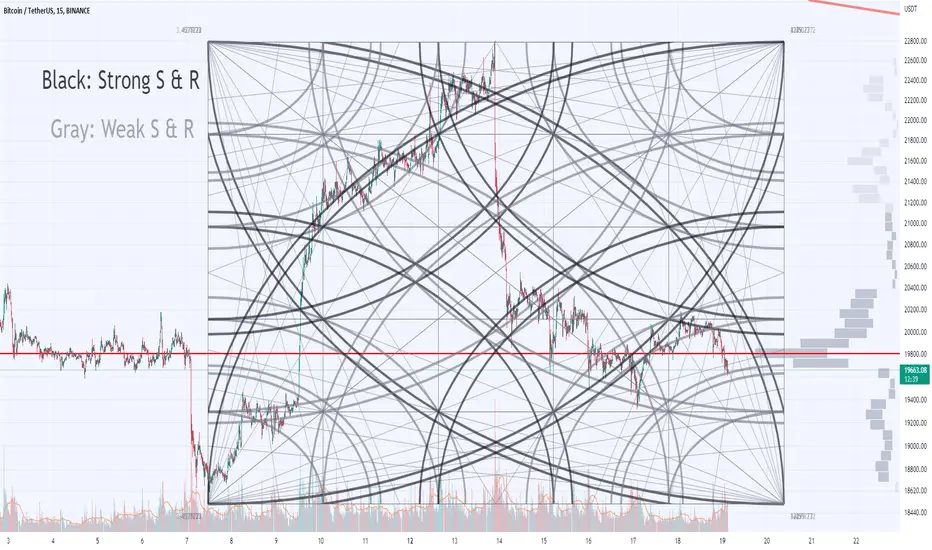
This is a short-TF analysis using Gann Square & arcs.
It seems no strong support is left for BTC in this timeframe.
Gann Square, the built-in smart tool of TradingView, is provided with many fans and arcs. Every single one of them, if properly plotted, is considered to serve as S & R. Not to mention their crosspoints.
In this chart, I applied it so that only the strong movements (progressive waves in the E.W. Theory) in the trend direction penetrate the arcs and the crosspoints.
The third and fifth arcs (black) are said to be stronger than others (gray).
노트
Update.
노트
Update.
*For trolls in the comment area, you might want to compare TA elements you happen to know with Gan Square you don't know, before posting useless something.
노트
As predicted, weak supports have all been broken.
Now at FE 3. 618, a possible rebound area, but it could go further down.

관련 발행물
면책사항
해당 정보와 게시물은 금융, 투자, 트레이딩 또는 기타 유형의 조언이나 권장 사항으로 간주되지 않으며, 트레이딩뷰에서 제공하거나 보증하는 것이 아닙니다. 자세한 내용은 이용 약관을 참조하세요.
면책사항
해당 정보와 게시물은 금융, 투자, 트레이딩 또는 기타 유형의 조언이나 권장 사항으로 간주되지 않으며, 트레이딩뷰에서 제공하거나 보증하는 것이 아닙니다. 자세한 내용은 이용 약관을 참조하세요.