
Bitcoin Chart Analysis in the 4-Hour Time Frame
1. Market Overview
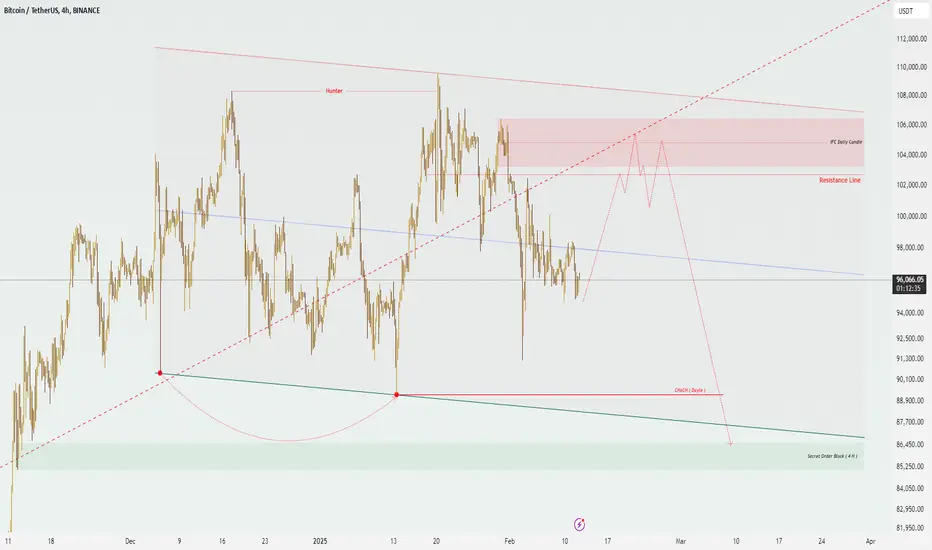
Currently, based on the analysis of weekly and monthly time frames, the Bitcoin market is in an upward trend, and we are waiting for a market correction. The drawn channel currently shows a soft price decline. Therefore, I have identified suitable sell positions:
Resistance Line: 102724.38
IFC Daily Candle: 103278.54
2. Technical Analysis of the 4-Hour Time Frame
In the 4-hour time frame, we have observed a Change of Character (CHoCH), indicating a temporary correction in the price trend. Our expectation is that after the correction ends, the price will reach the level of 86561.35 dollars. I will update the price chart again in the future.
Thank you for your support, dear friends!
Wishing you all the success!
Fereydoon Bahrami
A retail trader in the Wall Street trading Center (Forex)
Risk Disclosure:
Trading in the crypto market is risky due to high price changes. This analysis is just one person's opinion and shouldn't be taken as financial advice. Before investing, it's best to talk to a financial advisor and do your own research. You are responsible for any profits or losses from this analysis
1. Market Overview
Currently, based on the analysis of weekly and monthly time frames, the Bitcoin market is in an upward trend, and we are waiting for a market correction. The drawn channel currently shows a soft price decline. Therefore, I have identified suitable sell positions:
Resistance Line: 102724.38
IFC Daily Candle: 103278.54
2. Technical Analysis of the 4-Hour Time Frame
In the 4-hour time frame, we have observed a Change of Character (CHoCH), indicating a temporary correction in the price trend. Our expectation is that after the correction ends, the price will reach the level of 86561.35 dollars. I will update the price chart again in the future.
Thank you for your support, dear friends!
Wishing you all the success!
Fereydoon Bahrami
A retail trader in the Wall Street trading Center (Forex)
Risk Disclosure:
Trading in the crypto market is risky due to high price changes. This analysis is just one person's opinion and shouldn't be taken as financial advice. Before investing, it's best to talk to a financial advisor and do your own research. You are responsible for any profits or losses from this analysis

관련 발행물
면책사항
해당 정보와 게시물은 금융, 투자, 트레이딩 또는 기타 유형의 조언이나 권장 사항으로 간주되지 않으며, 트레이딩뷰에서 제공하거나 보증하는 것이 아닙니다. 자세한 내용은 이용 약관을 참조하세요.
면책사항
해당 정보와 게시물은 금융, 투자, 트레이딩 또는 기타 유형의 조언이나 권장 사항으로 간주되지 않으며, 트레이딩뷰에서 제공하거나 보증하는 것이 아닙니다. 자세한 내용은 이용 약관을 참조하세요.