
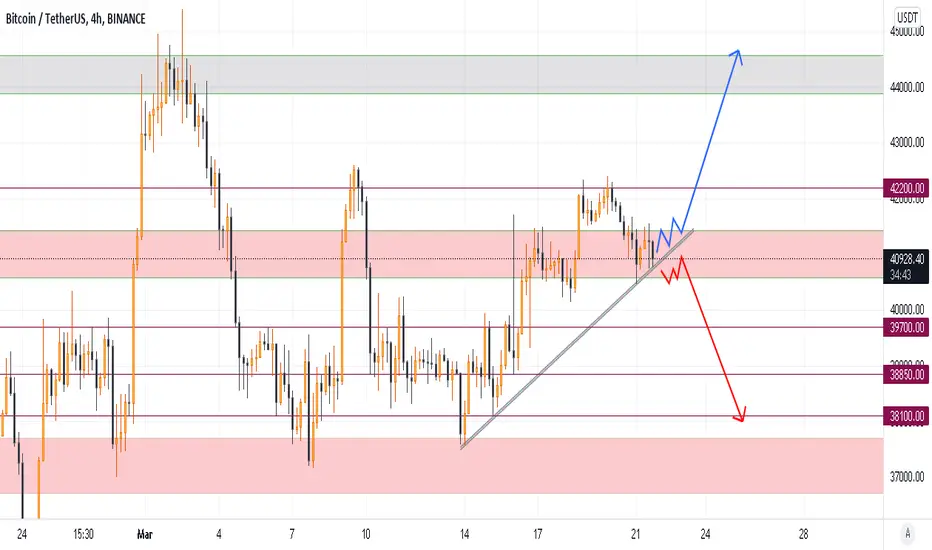
Hey Everyone, This is BTC Short Term Chart Technical Analysis which shows of course two scenarios but clear levels for trading.
The Trade set up is as follow:
If the Support trend line broke, we will wait for a pullback and confirmation which do not be a Fakeout then we will enter a short position with a stop loss above the support trend line and our targets are: 39700, 38850, 38100, 37000.
Or if the Price and candles remained above this support trend line we can open a long position for targets 42200, 44000 for short term.
Do not forget that this is not a buy or sell advice it's just my own opinion and technical Analysis. Do consider risks and manage it well.
Good Luck everyone.

면책사항
해당 정보와 게시물은 금융, 투자, 트레이딩 또는 기타 유형의 조언이나 권장 사항으로 간주되지 않으며, 트레이딩뷰에서 제공하거나 보증하는 것이 아닙니다. 자세한 내용은 이용 약관을 참조하세요.
면책사항
해당 정보와 게시물은 금융, 투자, 트레이딩 또는 기타 유형의 조언이나 권장 사항으로 간주되지 않으며, 트레이딩뷰에서 제공하거나 보증하는 것이 아닙니다. 자세한 내용은 이용 약관을 참조하세요.