
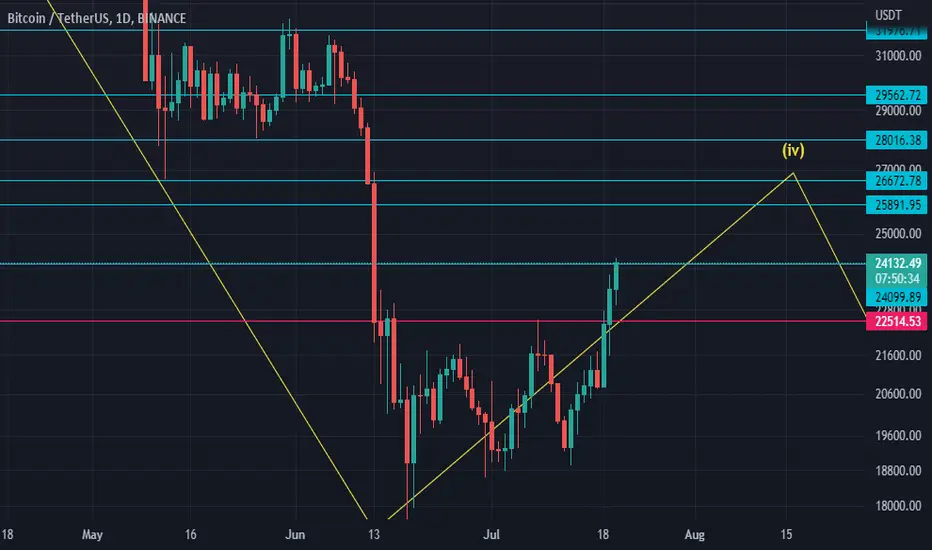
This is how I see BTC short-med-long term
as you see in the chart above I think BTC is in its 4th wave
mostly reverse around 0.38 fibo =~25700
I put other levels the price could reach
in this chart down, you can see the whole wave + the parallel channel

*
*
In this one, you can see the double-top and his target, reclaiming the nick-line is strongly bullish

*
*
there you can see USDT dominance targets and the potential reverse up to 10%

*
*
also, DXY is still bullish, as I mentioned before his targeting 112

*
conclusion, short-term bullish /mid-term bearish /long-term bullish
that could change if I saw a good move in the chart or if the price reclaimed important resistance like 28600 and 32000
I have other reasons to be bearish ( economic conditions )
boost this idea if you like it
as you see in the chart above I think BTC is in its 4th wave
mostly reverse around 0.38 fibo =~25700
I put other levels the price could reach
in this chart down, you can see the whole wave + the parallel channel
*
*
In this one, you can see the double-top and his target, reclaiming the nick-line is strongly bullish
*
*
there you can see USDT dominance targets and the potential reverse up to 10%
*
*
also, DXY is still bullish, as I mentioned before his targeting 112
*
conclusion, short-term bullish /mid-term bearish /long-term bullish
that could change if I saw a good move in the chart or if the price reclaimed important resistance like 28600 and 32000
I have other reasons to be bearish ( economic conditions )
boost this idea if you like it

관련 발행물
면책사항
해당 정보와 게시물은 금융, 투자, 트레이딩 또는 기타 유형의 조언이나 권장 사항으로 간주되지 않으며, 트레이딩뷰에서 제공하거나 보증하는 것이 아닙니다. 자세한 내용은 이용 약관을 참조하세요.
면책사항
해당 정보와 게시물은 금융, 투자, 트레이딩 또는 기타 유형의 조언이나 권장 사항으로 간주되지 않으며, 트레이딩뷰에서 제공하거나 보증하는 것이 아닙니다. 자세한 내용은 이용 약관을 참조하세요.