
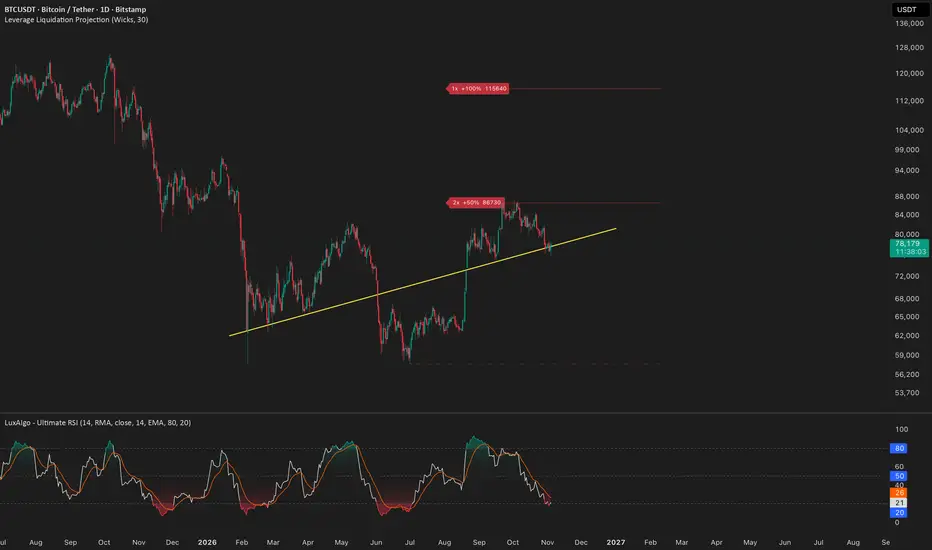
Daily timeframe
Let's look at what the chart is telling us right now.
1. The yellow trendline is holding. So far, buyers are managing to defend this level.
2. Volume is present, but still relatively weak. This is my biggest concern. Without stronger participation, any upward move could lack conviction.
3. Daily RSI has cooled down significantly. The market is no longer as overheated as it was before.
4. Market sentiment remains bearish. Interestingly, historical statistics suggest BTC often experiences a squeeze in early November following US elections. October has already been a month of correction, and markets have a habit of moving against the crowd's expectations.
5. Fear & Greed has cooled down. Not as much as I'd personally like to see, but it's a step in the right direction.
6. The liquidation map shows that nearby downside liquidity has already been cleared. This removes one of the obvious short-term downside magnets.
7. VDS shows no SELL signal. On lower timeframes, such as 1H, there are even local BUY signals.
8. LLP has reached its $86,700 target. The next target is $115K. Sounds pretty wild at the moment, but there's an interesting detail: this level coincides with the area where the market previously broke down into a sharp sell-off at the beginning of the bear market.
My take
I'm not saying a squeeze shouldn't happen. In fact, the current setup leaves room for one.
But I wouldn't build a trading plan around the assumption that it must happen.
Personally, I'd stick to spot positions or very small leverage here. The potential upside is interesting, but the lack of convincing volume makes aggressive positioning difficult to justify.
Stay flexible. Don't let a bullish scenario turn into a trading bias.
Let's look at what the chart is telling us right now.
1. The yellow trendline is holding. So far, buyers are managing to defend this level.
2. Volume is present, but still relatively weak. This is my biggest concern. Without stronger participation, any upward move could lack conviction.
3. Daily RSI has cooled down significantly. The market is no longer as overheated as it was before.
4. Market sentiment remains bearish. Interestingly, historical statistics suggest BTC often experiences a squeeze in early November following US elections. October has already been a month of correction, and markets have a habit of moving against the crowd's expectations.
5. Fear & Greed has cooled down. Not as much as I'd personally like to see, but it's a step in the right direction.
6. The liquidation map shows that nearby downside liquidity has already been cleared. This removes one of the obvious short-term downside magnets.
7. VDS shows no SELL signal. On lower timeframes, such as 1H, there are even local BUY signals.
8. LLP has reached its $86,700 target. The next target is $115K. Sounds pretty wild at the moment, but there's an interesting detail: this level coincides with the area where the market previously broke down into a sharp sell-off at the beginning of the bear market.
My take
I'm not saying a squeeze shouldn't happen. In fact, the current setup leaves room for one.
But I wouldn't build a trading plan around the assumption that it must happen.
Personally, I'd stick to spot positions or very small leverage here. The potential upside is interesting, but the lack of convincing volume makes aggressive positioning difficult to justify.
Stay flexible. Don't let a bullish scenario turn into a trading bias.

VMS://RACCOON — Cutting through the noise.
YouTube: youtube.com/@VMSRACCOON
Telegram: t.me/vms_raccoon
X: x.com/vms_raccoon
Not financial advice
YouTube: youtube.com/@VMSRACCOON
Telegram: t.me/vms_raccoon
X: x.com/vms_raccoon
Not financial advice
면책사항
해당 정보와 게시물은 금융, 투자, 트레이딩 또는 기타 유형의 조언이나 권장 사항으로 간주되지 않으며, 트레이딩뷰에서 제공하거나 보증하는 것이 아닙니다. 자세한 내용은 이용 약관을 참조하세요.
VMS://RACCOON — Cutting through the noise.
YouTube: youtube.com/@VMSRACCOON
Telegram: t.me/vms_raccoon
X: x.com/vms_raccoon
Not financial advice
YouTube: youtube.com/@VMSRACCOON
Telegram: t.me/vms_raccoon
X: x.com/vms_raccoon
Not financial advice
면책사항
해당 정보와 게시물은 금융, 투자, 트레이딩 또는 기타 유형의 조언이나 권장 사항으로 간주되지 않으며, 트레이딩뷰에서 제공하거나 보증하는 것이 아닙니다. 자세한 내용은 이용 약관을 참조하세요.