
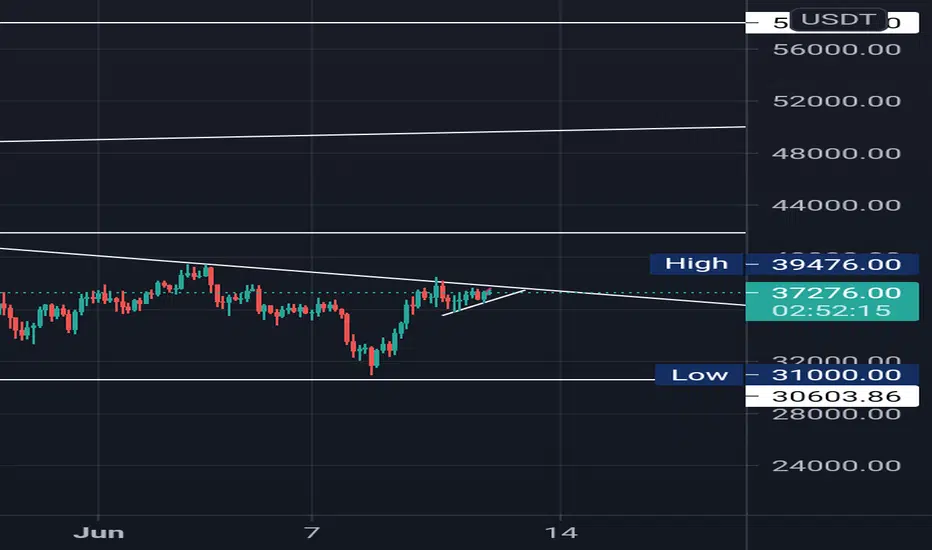
After 30,000 low
On 1D time frame we can see a descending triangle.
When we move to 4hr chart one more pattern " symmetric triangle " forming at the resistance of descending triangle (1D)
Moving at 15 min chart noticed a flag and pole condition the rsi was indicating OB.
I've entered at 37095 with sl or 36375 and target with 40,000 as round figure and 41900 (t2)
On 1D time frame we can see a descending triangle.
When we move to 4hr chart one more pattern " symmetric triangle " forming at the resistance of descending triangle (1D)
Moving at 15 min chart noticed a flag and pole condition the rsi was indicating OB.
I've entered at 37095 with sl or 36375 and target with 40,000 as round figure and 41900 (t2)

면책사항
해당 정보와 게시물은 금융, 투자, 트레이딩 또는 기타 유형의 조언이나 권장 사항으로 간주되지 않으며, 트레이딩뷰에서 제공하거나 보증하는 것이 아닙니다. 자세한 내용은 이용 약관을 참조하세요.
면책사항
해당 정보와 게시물은 금융, 투자, 트레이딩 또는 기타 유형의 조언이나 권장 사항으로 간주되지 않으며, 트레이딩뷰에서 제공하거나 보증하는 것이 아닙니다. 자세한 내용은 이용 약관을 참조하세요.