
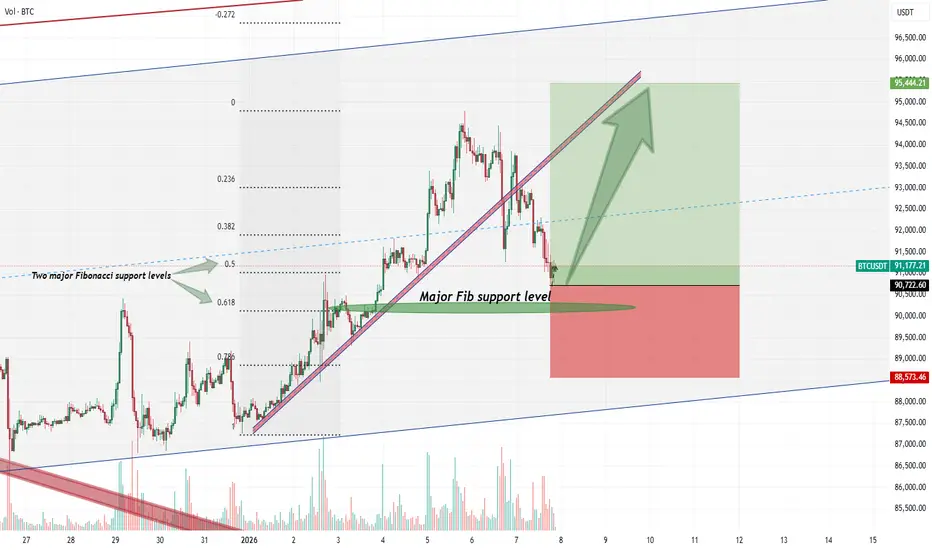
1. Fibonacci Analysis:
the significance of the 0.5 (50%) and 0.618 (61.8%) Fibonacci retracement levels derived from the prior major swing. These are two of the most critical confluence zones in technical analysis, where institutional and algorithmic buy-side liquidity is often clustered.
2. Price Action Interpretation:
The fact that the price has respected these levels and initiated a bounce indicates strong underlying demand. The current test of this Fibonacci support cluster is a classic bullish consolidation pattern within a larger uptrend. A firm rejection from this zone would confirm the strength of the trend and signal that the correction is likely complete.
3. Market Expectation:
We anticipate that this Fibonacci support confluence will hold strong, serving as a launchpad for the next impulsive wave. A successful hold here increases the probability of a resumption of the uptrend, targeting a break above the recent high and extension toward new cycle highs.
4. Trade Signal & Risk Management:
Direction: Long
Trigger: A bullish rejection candle (e.g., hammer, bullish engulfing) on the 4H or daily chart at the 0.5–0.618 Fib zone, accompanied by rising volume.
Stop-Loss (SL): Placed just below the 0.78 Fib level (e.g., below $88600) to invalidate the thesis on a breakdown.
Take-Profit (TP): Set at a 1:2 Risk-Reward (R:R) ratio. The first TP target would be the prior swing high, with the final TP projected for a measured move toward new highs.
Risk: Position size must be calculated so that the potential loss from the SL is within your strict maximum risk-per-trade parameters (e.g., 1-2% of portfolio).
Summary:
The confluence of two major Fibonacci retracements provides a high-probability, low-risk area for a long entry. The setup offers a favorable asymmetric risk-reward profile (1:2 R:R). Execution depends on a confirmed bullish reaction at the defined support zone.
😊DISCLAIMER: ((trade based on your own decision))👽
the significance of the 0.5 (50%) and 0.618 (61.8%) Fibonacci retracement levels derived from the prior major swing. These are two of the most critical confluence zones in technical analysis, where institutional and algorithmic buy-side liquidity is often clustered.
2. Price Action Interpretation:
The fact that the price has respected these levels and initiated a bounce indicates strong underlying demand. The current test of this Fibonacci support cluster is a classic bullish consolidation pattern within a larger uptrend. A firm rejection from this zone would confirm the strength of the trend and signal that the correction is likely complete.
3. Market Expectation:
We anticipate that this Fibonacci support confluence will hold strong, serving as a launchpad for the next impulsive wave. A successful hold here increases the probability of a resumption of the uptrend, targeting a break above the recent high and extension toward new cycle highs.
4. Trade Signal & Risk Management:
Direction: Long
Trigger: A bullish rejection candle (e.g., hammer, bullish engulfing) on the 4H or daily chart at the 0.5–0.618 Fib zone, accompanied by rising volume.
Stop-Loss (SL): Placed just below the 0.78 Fib level (e.g., below $88600) to invalidate the thesis on a breakdown.
Take-Profit (TP): Set at a 1:2 Risk-Reward (R:R) ratio. The first TP target would be the prior swing high, with the final TP projected for a measured move toward new highs.
Risk: Position size must be calculated so that the potential loss from the SL is within your strict maximum risk-per-trade parameters (e.g., 1-2% of portfolio).
Summary:
The confluence of two major Fibonacci retracements provides a high-probability, low-risk area for a long entry. The setup offers a favorable asymmetric risk-reward profile (1:2 R:R). Execution depends on a confirmed bullish reaction at the defined support zone.
😊DISCLAIMER: ((trade based on your own decision))👽
액티브 트레이드
Full target reached price react well to the support zone.
Bybit #2 exchange. New users: get up to $35K rewards + $100 free bonus via link. 👇
shorturl.at/sqBpx
My telegram channel: t.me/mmbtchannel
VIP Channels:
Crypto +390% & Forex:+600Pips monthly.
check My telegram for more info VIPs.
shorturl.at/sqBpx
My telegram channel: t.me/mmbtchannel
VIP Channels:
Crypto +390% & Forex:+600Pips monthly.
check My telegram for more info VIPs.
관련 발행물
면책사항
해당 정보와 게시물은 금융, 투자, 트레이딩 또는 기타 유형의 조언이나 권장 사항으로 간주되지 않으며, 트레이딩뷰에서 제공하거나 보증하는 것이 아닙니다. 자세한 내용은 이용 약관을 참조하세요.
Bybit #2 exchange. New users: get up to $35K rewards + $100 free bonus via link. 👇
shorturl.at/sqBpx
My telegram channel: t.me/mmbtchannel
VIP Channels:
Crypto +390% & Forex:+600Pips monthly.
check My telegram for more info VIPs.
shorturl.at/sqBpx
My telegram channel: t.me/mmbtchannel
VIP Channels:
Crypto +390% & Forex:+600Pips monthly.
check My telegram for more info VIPs.
관련 발행물
면책사항
해당 정보와 게시물은 금융, 투자, 트레이딩 또는 기타 유형의 조언이나 권장 사항으로 간주되지 않으며, 트레이딩뷰에서 제공하거나 보증하는 것이 아닙니다. 자세한 내용은 이용 약관을 참조하세요.