
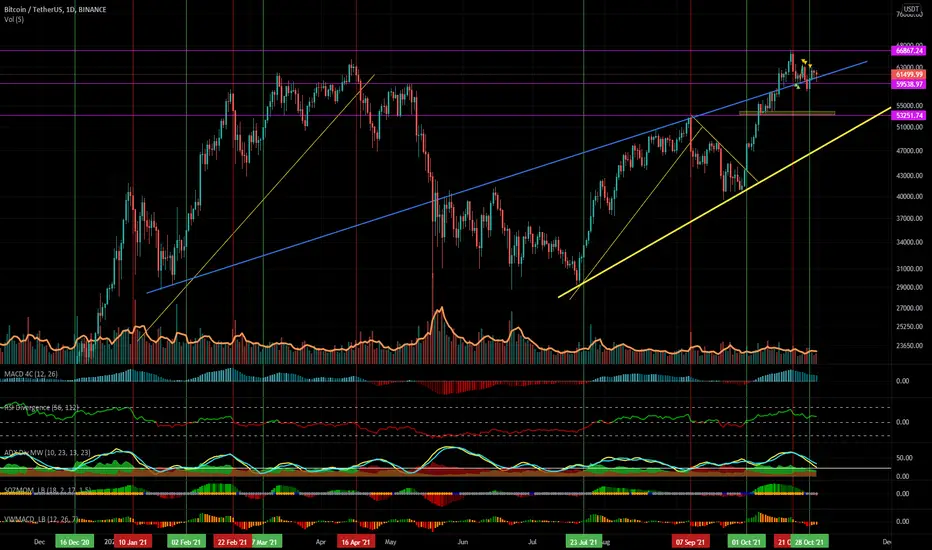
It's good to regularly zoom out on a chart to get a better understanding of what's happening in the wider scheme. Looking at this chart we can see that we have had a very strong move up from the corrective low and she just needed to cool off a little. In the past few weeks BTC has been trading in a range between $60K and $67K. All attempts to break down from this zone have failed. We are still well above the long term trend (thick yellow line). The most significant influences on its current price are two support trend lines. One is the purple support line from previous highs, and the other (blue) is a longer time frame uptrend line that appears to be providing good support for the current price to move up. As I've mentioned previously, price fell below these two and was quickly snapped back up into the demand zone above them.
Price can still fall through these levels but if it does there are quite a few lines of support to and demand to catch it. So I'm still bullish and with significant support sitting below the current price there is a good probability that we will see more upside to price action.
Price can still fall through these levels but if it does there are quite a few lines of support to and demand to catch it. So I'm still bullish and with significant support sitting below the current price there is a good probability that we will see more upside to price action.

관련 발행물
면책사항
해당 정보와 게시물은 금융, 투자, 트레이딩 또는 기타 유형의 조언이나 권장 사항으로 간주되지 않으며, 트레이딩뷰에서 제공하거나 보증하는 것이 아닙니다. 자세한 내용은 이용 약관을 참조하세요.
면책사항
해당 정보와 게시물은 금융, 투자, 트레이딩 또는 기타 유형의 조언이나 권장 사항으로 간주되지 않으며, 트레이딩뷰에서 제공하거나 보증하는 것이 아닙니다. 자세한 내용은 이용 약관을 참조하세요.