
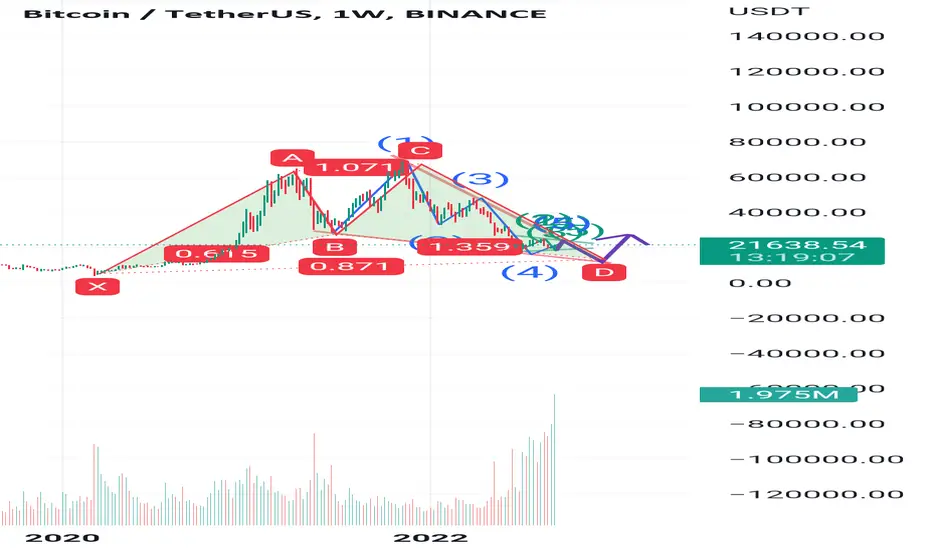
Everyone is extremely bullish right now and is saying the bottom is in . But I am still very sceptical . We are having a relief uptrend as predicted in my last analysis . • The downtrend is really strong and there is absolutely no sign of a trend reversal at this moment ! • As you can see on the weekly chart , we have an incomplete falling wedge pattern and clearly there is still a lot of price action missing . • It looks like we are creating a trading range on the daily chart . Something like a symmetrical or _descending triangle . Regarding my Elliott Wave analysis , I think we can create some kind of triangular formation before continuing lower . • The question is , how much lower can we go ? We have a gap at 12 500 USDT , which is at reasonable target and the one and only one support on this particular chart . We can use a fibonacci extension from wave 3 to wave 4 , but it's still too early because we don't know if wave 4 was completed or not . • If the trading range is confirmed , then altcoins can moon during this phase and Bitcoin's dominance should continue in the downtrend . • For more analysis , hit " Like " and " Follow " ! Support and Resistance Fundamental Analysis
If you look at the figure, you will see a harmonic pattern. I am Dr. Amir Hossein Heydari, a harmonic expert, and I say again that this pattern is incomplete, if it is completed, it will see the target.
So it is better to wait and wait for the angle of the last side. This is just a prediction
If you look at the figure, you will see a harmonic pattern. I am Dr. Amir Hossein Heydari, a harmonic expert, and I say again that this pattern is incomplete, if it is completed, it will see the target.
So it is better to wait and wait for the angle of the last side. This is just a prediction

면책사항
해당 정보와 게시물은 금융, 투자, 트레이딩 또는 기타 유형의 조언이나 권장 사항으로 간주되지 않으며, 트레이딩뷰에서 제공하거나 보증하는 것이 아닙니다. 자세한 내용은 이용 약관을 참조하세요.
면책사항
해당 정보와 게시물은 금융, 투자, 트레이딩 또는 기타 유형의 조언이나 권장 사항으로 간주되지 않으며, 트레이딩뷰에서 제공하거나 보증하는 것이 아닙니다. 자세한 내용은 이용 약관을 참조하세요.