
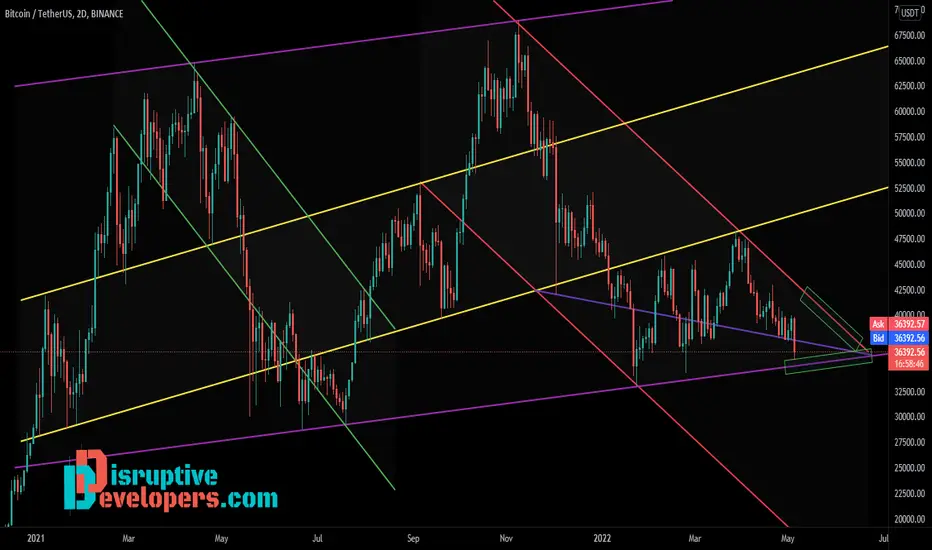
This chart shows my thoughts on the Higher Time Frame (HTF) for BTC .
Most people have a Higher Time Frame (HTF) chart, what does yours look like?
Parallel Channels
This chart is on a 2 day timeframe, it consist of several parallel channels. Price wicked into my green box of interest at the bottom of the violet channel. Channels and trendlines can act as great support and resistance.
I have an alert set for 35400, if this fires I will reassess and potentially prepare for a long trade.

면책사항
해당 정보와 게시물은 금융, 투자, 트레이딩 또는 기타 유형의 조언이나 권장 사항으로 간주되지 않으며, 트레이딩뷰에서 제공하거나 보증하는 것이 아닙니다. 자세한 내용은 이용 약관을 참조하세요.
면책사항
해당 정보와 게시물은 금융, 투자, 트레이딩 또는 기타 유형의 조언이나 권장 사항으로 간주되지 않으며, 트레이딩뷰에서 제공하거나 보증하는 것이 아닙니다. 자세한 내용은 이용 약관을 참조하세요.