
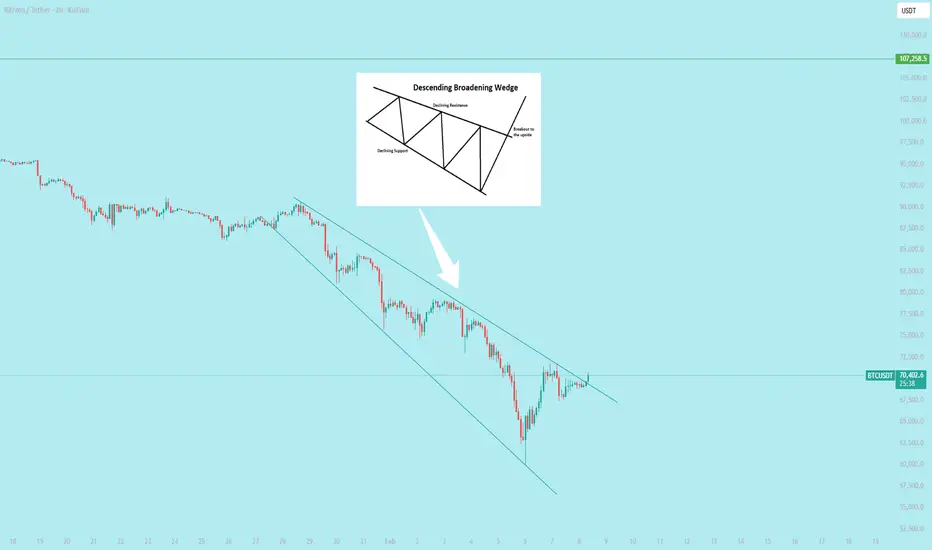
Bitcoin has broken out of a **Descending Broadening Wedge** pattern on the **2-hour timeframe**!
This classic pattern features diverging downward-sloping trendlines with increasing volatility — often appearing at the end of a consolidation or downtrend phase. Statistically, descending broadening wedges show a strong bullish bias on upward breakouts (around 70-80% probability in many historical studies).
We've now seen a clean break above the upper resistance line, signaling that buyers are taking control with fresh momentum.
**Current Situation (as of Feb 8, 2026):**
- BTC is trading around $69,000–$70,000 after recent choppy action and a sharp dip/recovery earlier this week.
- The breakout looks promising, but crypto remains volatile — watch closely!
**Key Things to Monitor:**
✅ **Confirmation**: Price needs to hold firmly above the breakout level with rising volume to confirm strength and lower fakeout risk.
⚠️ **Fakeout Danger**: If price reverses quickly back into the wedge or turns the broken line into resistance, the setup could fail (watch recent lows for invalidation).
🎯 **Potential Targets**: If momentum builds, a measured move from the pattern could deliver a solid upward leg — room for a nice pump if buyers stay aggressive.
Stay disciplined: Manage your risk, avoid FOMO chasing, and don't go all-in blindly. This could kick off a strong move, but remember — Bitcoin loves throwing fakeouts! 😅

면책사항
해당 정보와 게시물은 금융, 투자, 트레이딩 또는 기타 유형의 조언이나 권장 사항으로 간주되지 않으며, 트레이딩뷰에서 제공하거나 보증하는 것이 아닙니다. 자세한 내용은 이용 약관을 참조하세요.
면책사항
해당 정보와 게시물은 금융, 투자, 트레이딩 또는 기타 유형의 조언이나 권장 사항으로 간주되지 않으며, 트레이딩뷰에서 제공하거나 보증하는 것이 아닙니다. 자세한 내용은 이용 약관을 참조하세요.