
Bitcoin Technical Analysis - Bearish Scenario & Elliott Wave Count
Greetings traders and investors,
Current Analysis:
The current BTC scenario appears bearish. As discussed earlier, I highlighted the likelihood of a significant dump. I hope you adhered to the warning and avoided long trades around $70,000 - $72,000.
Chart Analysis Recap:
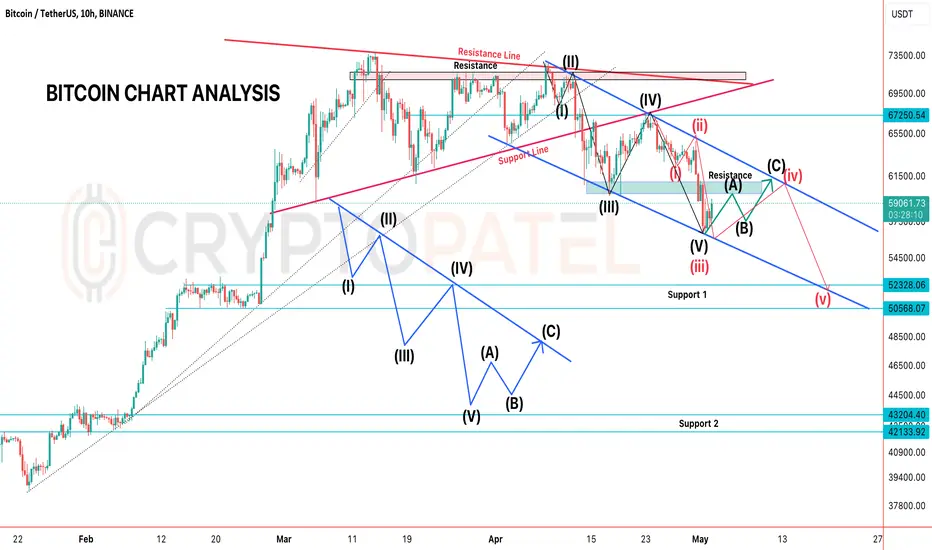
The chart shows a clear bullish pennant formation, usually indicating a bullish trend. However, based on my experience, the market often moves contrary to expectations.
Pennant Breakdown:
#BTC briefly broke upwards before a fakeout and a subsequent breakdown below the bullish pennant.
Critical Breakdown:
After breaking below the $66,000 level, #Bitcoin dropped further past the red trend line and retested $67,400. Many traders, fearing missing out, opened long positions at this level only to be liquidated shortly afterward.
Elliott Wave Count:
We're currently in the 5th count of a fresh Elliott Wave and the 3rd sub-wave count. Expect a slight upward move to fulfill the "A" and "B" count.
Upward Move:
Expect a short-term pump towards $61,000 - $62,000.
Major Dump: Post-pump, BTC could dip further to $50,000, with potential dips toward $45,000.
Support & Resistance Levels:
Support: $51,000 / $42,000
Resistance: $62,000
Note:
If BTC breaks above the $62,000 resistance, the Elliott Wave count could change, then i will update.
Like & share if you agree with my Analysis
Trade safely,
Greetings traders and investors,
Current Analysis:
The current BTC scenario appears bearish. As discussed earlier, I highlighted the likelihood of a significant dump. I hope you adhered to the warning and avoided long trades around $70,000 - $72,000.
Chart Analysis Recap:
The chart shows a clear bullish pennant formation, usually indicating a bullish trend. However, based on my experience, the market often moves contrary to expectations.
Pennant Breakdown:
#BTC briefly broke upwards before a fakeout and a subsequent breakdown below the bullish pennant.
Critical Breakdown:
After breaking below the $66,000 level, #Bitcoin dropped further past the red trend line and retested $67,400. Many traders, fearing missing out, opened long positions at this level only to be liquidated shortly afterward.
Elliott Wave Count:
We're currently in the 5th count of a fresh Elliott Wave and the 3rd sub-wave count. Expect a slight upward move to fulfill the "A" and "B" count.
Upward Move:
Expect a short-term pump towards $61,000 - $62,000.
Major Dump: Post-pump, BTC could dip further to $50,000, with potential dips toward $45,000.
Support & Resistance Levels:
Support: $51,000 / $42,000
Resistance: $62,000
Note:
If BTC breaks above the $62,000 resistance, the Elliott Wave count could change, then i will update.
Like & share if you agree with my Analysis
Trade safely,

Twitter: twitter.com/CryptoPatel
Telegram: t.me/OfficialCryptoPatel
Instagram: instagram.com/cryptopatel?utm_medium=copy_link
Telegram: t.me/OfficialCryptoPatel
Instagram: instagram.com/cryptopatel?utm_medium=copy_link
관련 발행물
면책사항
해당 정보와 게시물은 금융, 투자, 트레이딩 또는 기타 유형의 조언이나 권장 사항으로 간주되지 않으며, 트레이딩뷰에서 제공하거나 보증하는 것이 아닙니다. 자세한 내용은 이용 약관을 참조하세요.
Twitter: twitter.com/CryptoPatel
Telegram: t.me/OfficialCryptoPatel
Instagram: instagram.com/cryptopatel?utm_medium=copy_link
Telegram: t.me/OfficialCryptoPatel
Instagram: instagram.com/cryptopatel?utm_medium=copy_link
관련 발행물
면책사항
해당 정보와 게시물은 금융, 투자, 트레이딩 또는 기타 유형의 조언이나 권장 사항으로 간주되지 않으며, 트레이딩뷰에서 제공하거나 보증하는 것이 아닙니다. 자세한 내용은 이용 약관을 참조하세요.