
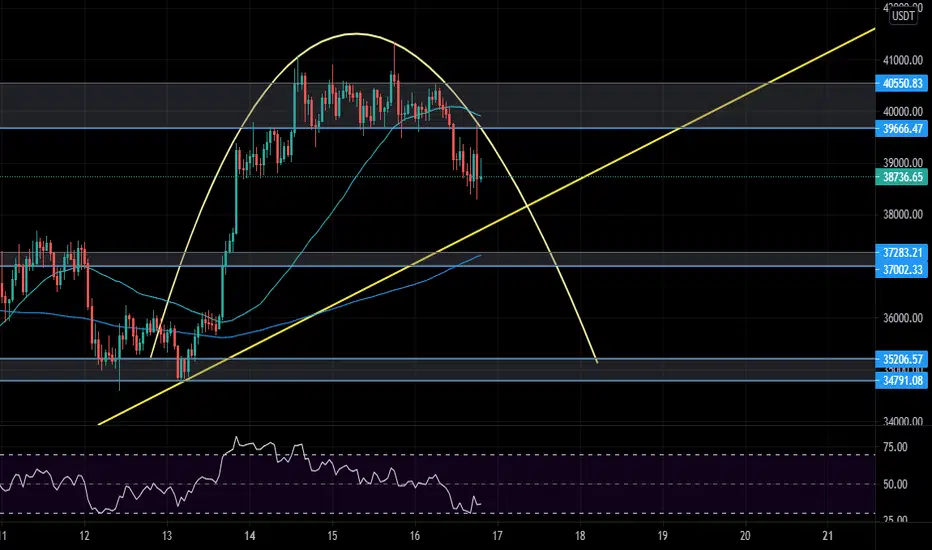
On June 14, we witnessed bitcoin breaking out of it's flag and reaching its 40,000 resistance. As we can see that bitcoin has been rejected by the 40,000 resistance multiple times and eventually started moving down. What it looks like to me is that there is an inverted cup and handle pattern forming in 1H timeframe. If this pattern is completed then we might see bitcoin touching it's 30,000 resistance and if it breaks out of 30,000 resistance as well, the next stop of bitcoin will be 26,000.

면책사항
해당 정보와 게시물은 금융, 투자, 트레이딩 또는 기타 유형의 조언이나 권장 사항으로 간주되지 않으며, 트레이딩뷰에서 제공하거나 보증하는 것이 아닙니다. 자세한 내용은 이용 약관을 참조하세요.
면책사항
해당 정보와 게시물은 금융, 투자, 트레이딩 또는 기타 유형의 조언이나 권장 사항으로 간주되지 않으며, 트레이딩뷰에서 제공하거나 보증하는 것이 아닙니다. 자세한 내용은 이용 약관을 참조하세요.