
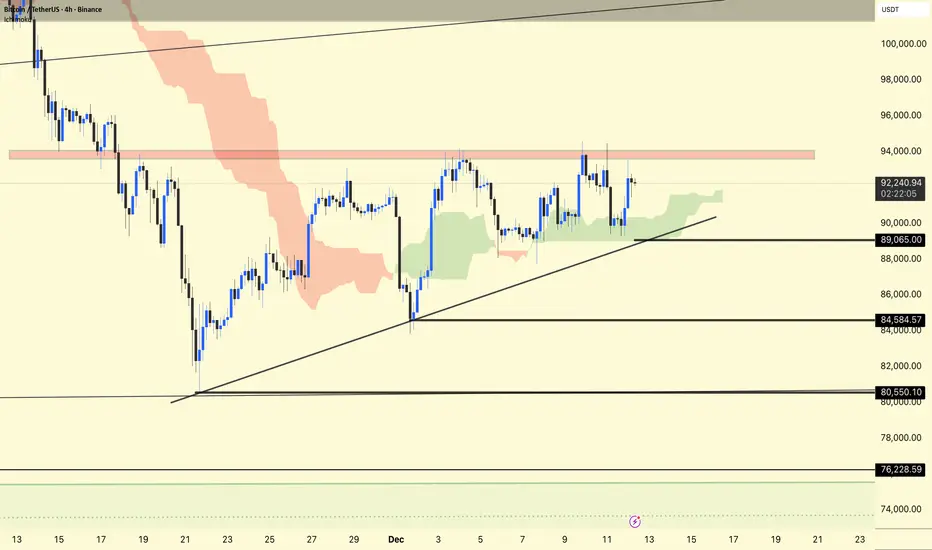
the 4H chart, BTCUSDT is consolidating in a tight range, holding above a rising trendline, while repeatedly rejecting from the same 93,500–94,500 resistance block.
The price is trading near rising support from the Ichimoku Cloud and lows of 82,000–83,000. Local horizontal support is now around 89,000–89,100, and if the trendline fails, deeper support is at 84,584 and 80,550.
As long as candles close above the trendline and 89,000, the setup favors another attempt to break the red resistance band; a clean 4H close above 94.5k would create room for a move towards 96,000–100,000.
A decisive break below the diagonal plus 89k level reveals a move first to 84.5k and then to 80.5k, where the larger, higher-timeframe demand zone and previous bounce began.
DYOR | NFA
The price is trading near rising support from the Ichimoku Cloud and lows of 82,000–83,000. Local horizontal support is now around 89,000–89,100, and if the trendline fails, deeper support is at 84,584 and 80,550.
As long as candles close above the trendline and 89,000, the setup favors another attempt to break the red resistance band; a clean 4H close above 94.5k would create room for a move towards 96,000–100,000.
A decisive break below the diagonal plus 89k level reveals a move first to 84.5k and then to 80.5k, where the larger, higher-timeframe demand zone and previous bounce began.
DYOR | NFA

관련 발행물
면책사항
해당 정보와 게시물은 금융, 투자, 트레이딩 또는 기타 유형의 조언이나 권장 사항으로 간주되지 않으며, 트레이딩뷰에서 제공하거나 보증하는 것이 아닙니다. 자세한 내용은 이용 약관을 참조하세요.
관련 발행물
면책사항
해당 정보와 게시물은 금융, 투자, 트레이딩 또는 기타 유형의 조언이나 권장 사항으로 간주되지 않으며, 트레이딩뷰에서 제공하거나 보증하는 것이 아닙니다. 자세한 내용은 이용 약관을 참조하세요.