
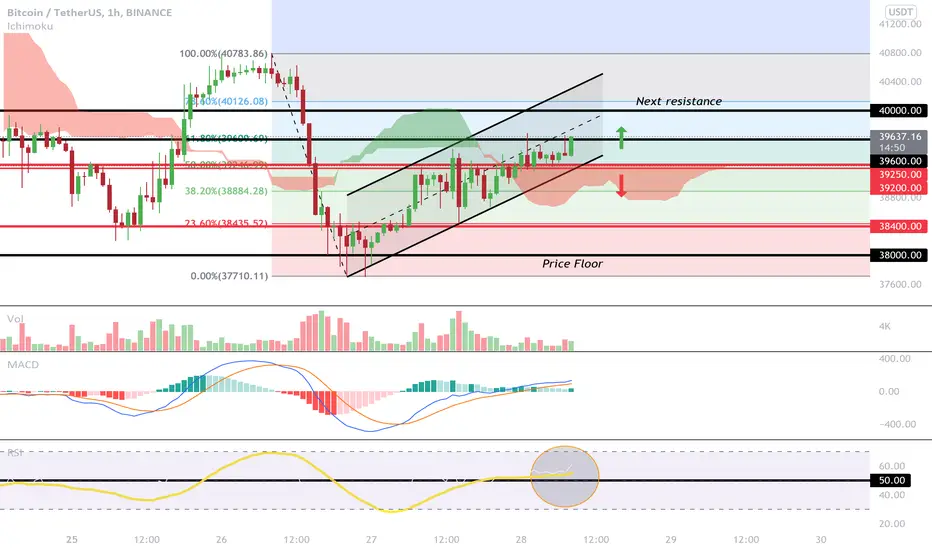
The price of BTC has formed a price floor above $ 38,000, which can be considered a price recovery. As we have seen, the resistance levels of $ 38,400 and $ 38,500 have been broken.
The price even reached 39,500, but the sellers dropped the price to 39,600. It is currently trading at around $ 39,300 and a 100-hour moving average.
During this period, an uptrend line has been formed with the support of $ 39220 in the hourly chart. At the top, its closest resistance is in the $ 39,600 range, Which Bitcoin is currently involved in.
The 61.8% Fibonacci level is close to $ 39,609. The next key resistance is in the $ 40,000 range. A close above the 39609 level and a simple 100-hour moving average could be a good start to the price increase, in which case there is a possibility of crossing the 40,000 resistance. Also, after that, the next resistance is around $ 40,780.
But if Bitcoin fails to cross the $ 39,600 resistance level, we will see its price fall. Its first support is in the $ 39,250 range. The next important support is $ 39,200, the break of which could be the beginning of another price drop. If this happens, the price could fall to $ 38,400.
Also, keep in mind that the RSI is above the 50 levels, and the MACD is losing momentum in the uptrend range.
The price even reached 39,500, but the sellers dropped the price to 39,600. It is currently trading at around $ 39,300 and a 100-hour moving average.
During this period, an uptrend line has been formed with the support of $ 39220 in the hourly chart. At the top, its closest resistance is in the $ 39,600 range, Which Bitcoin is currently involved in.
The 61.8% Fibonacci level is close to $ 39,609. The next key resistance is in the $ 40,000 range. A close above the 39609 level and a simple 100-hour moving average could be a good start to the price increase, in which case there is a possibility of crossing the 40,000 resistance. Also, after that, the next resistance is around $ 40,780.
But if Bitcoin fails to cross the $ 39,600 resistance level, we will see its price fall. Its first support is in the $ 39,250 range. The next important support is $ 39,200, the break of which could be the beginning of another price drop. If this happens, the price could fall to $ 38,400.
Also, keep in mind that the RSI is above the 50 levels, and the MACD is losing momentum in the uptrend range.

Join the free Telegram channel
💎 Telegram Channel: t.me/MonoCoin_Public
🔔 Bot: t.me/MonoCoinSignal_Bot?start=starter_tv
🌐 Website: MonoCoin.net
⭐️ 5-Star TrustPilot: trustpilot.com/review/monocoin.net
💎 Telegram Channel: t.me/MonoCoin_Public
🔔 Bot: t.me/MonoCoinSignal_Bot?start=starter_tv
🌐 Website: MonoCoin.net
⭐️ 5-Star TrustPilot: trustpilot.com/review/monocoin.net
면책사항
해당 정보와 게시물은 금융, 투자, 트레이딩 또는 기타 유형의 조언이나 권장 사항으로 간주되지 않으며, 트레이딩뷰에서 제공하거나 보증하는 것이 아닙니다. 자세한 내용은 이용 약관을 참조하세요.
Join the free Telegram channel
💎 Telegram Channel: t.me/MonoCoin_Public
🔔 Bot: t.me/MonoCoinSignal_Bot?start=starter_tv
🌐 Website: MonoCoin.net
⭐️ 5-Star TrustPilot: trustpilot.com/review/monocoin.net
💎 Telegram Channel: t.me/MonoCoin_Public
🔔 Bot: t.me/MonoCoinSignal_Bot?start=starter_tv
🌐 Website: MonoCoin.net
⭐️ 5-Star TrustPilot: trustpilot.com/review/monocoin.net
면책사항
해당 정보와 게시물은 금융, 투자, 트레이딩 또는 기타 유형의 조언이나 권장 사항으로 간주되지 않으며, 트레이딩뷰에서 제공하거나 보증하는 것이 아닙니다. 자세한 내용은 이용 약관을 참조하세요.