
Bitcoin "Channel Trend" Buying Climax
Hourly Time Frame Analysis
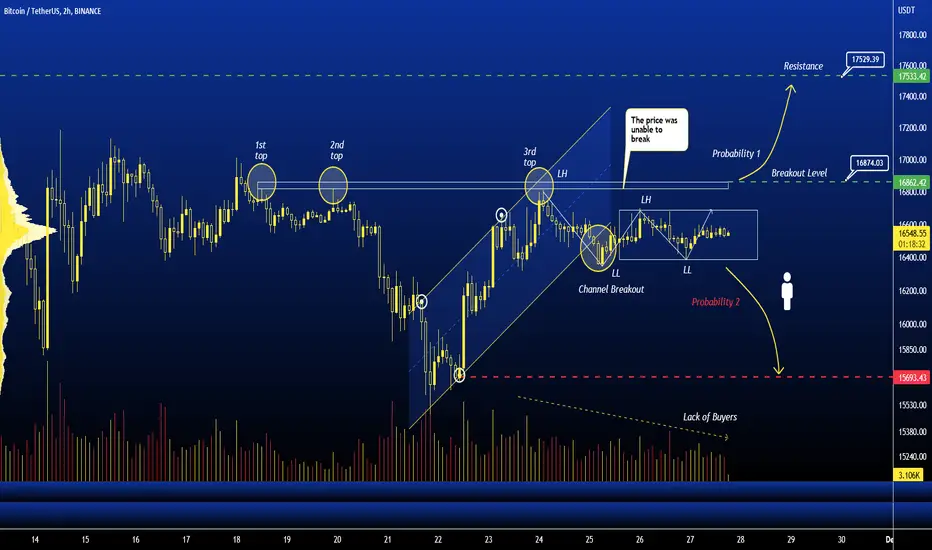
Since the 21st of November, Bitcoin has traded in the Ascending Channel Pattern range, and on the 25th of November, Bitcoin breached the Channel Trend Resistance with average volume, which should have improved exit odds and caused the price to begin consolidating in the range of 16385 $ to 16685 $.
As a result, we can anticipate two possibilities for price action based on the current movement.
Probability 1 : Price may break through the breakout level and price will rise to the resistance level of 17520 $.
Probability 2 : Once the Lower Low structure is broken, we may see a reversal trend, and then price may fall to the next support level of 15960$.
Happy Trading
Hourly Time Frame Analysis
Since the 21st of November, Bitcoin has traded in the Ascending Channel Pattern range, and on the 25th of November, Bitcoin breached the Channel Trend Resistance with average volume, which should have improved exit odds and caused the price to begin consolidating in the range of 16385 $ to 16685 $.
As a result, we can anticipate two possibilities for price action based on the current movement.
Probability 1 : Price may break through the breakout level and price will rise to the resistance level of 17520 $.
Probability 2 : Once the Lower Low structure is broken, we may see a reversal trend, and then price may fall to the next support level of 15960$.
Happy Trading

관련 발행물
면책사항
해당 정보와 게시물은 금융, 투자, 트레이딩 또는 기타 유형의 조언이나 권장 사항으로 간주되지 않으며, 트레이딩뷰에서 제공하거나 보증하는 것이 아닙니다. 자세한 내용은 이용 약관을 참조하세요.
면책사항
해당 정보와 게시물은 금융, 투자, 트레이딩 또는 기타 유형의 조언이나 권장 사항으로 간주되지 않으며, 트레이딩뷰에서 제공하거나 보증하는 것이 아닙니다. 자세한 내용은 이용 약관을 참조하세요.