
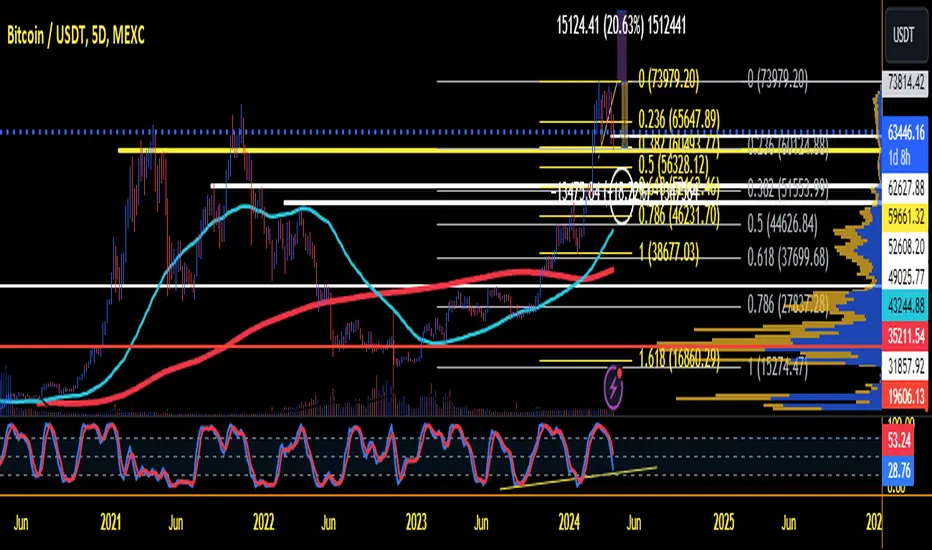
On the 5 day you can see if you draw 2 fibs, one from the last break up... in yellow, another fib, grey from cycle low to top, and look back, you can see that there are 3 tops that need to be tested from previous cycle.
when you draw the yellow fib, the previous high has to be tested, that's between the 6.18 & 78.6, 90% of the time, that top gets tested, roughly 49K, the 61.8 is just above that, and that also has a top lined up with it at 52.6K those are the 2 white lines and the white circle area. The 5D 200sma will be up to those levels in a couple candles also
BTC has dipped 20% or so and usually dips 30-40% before or close to the Halving, back test that yourself...
So play with this chart, and a second post wiil be up in a few minutes to back up this 5 day with a 6 hours wave chart
Worst case $32K hasn't been re-tested either... that's a bit low but would like that price for a wick,
All of these could be flash wicks so set limit buys above with stop losses, in several small orders per level, just one limit order at $32-34K
when you draw the yellow fib, the previous high has to be tested, that's between the 6.18 & 78.6, 90% of the time, that top gets tested, roughly
49K, the 61.8 is just above that, and that also has a top lined up with it at 52.6K those are the 2 white lines and the white circle area. The 5D 200sma will be up to those levels in a couple candles alsoBTC has dipped 20% or so and usually dips 30-40% before or close to the Halving, back test that yourself...
So play with this chart, and a second post wiil be up in a few minutes to back up this 5 day with a 6 hours wave chart
Worst case $32K hasn't been re-tested either... that's a bit low but would like that price for a wick,
All of these could be flash wicks so set limit buys above with stop losses, in several small orders per level, just one limit order at $32-34K

면책사항
해당 정보와 게시물은 금융, 투자, 트레이딩 또는 기타 유형의 조언이나 권장 사항으로 간주되지 않으며, 트레이딩뷰에서 제공하거나 보증하는 것이 아닙니다. 자세한 내용은 이용 약관을 참조하세요.
면책사항
해당 정보와 게시물은 금융, 투자, 트레이딩 또는 기타 유형의 조언이나 권장 사항으로 간주되지 않으며, 트레이딩뷰에서 제공하거나 보증하는 것이 아닙니다. 자세한 내용은 이용 약관을 참조하세요.