
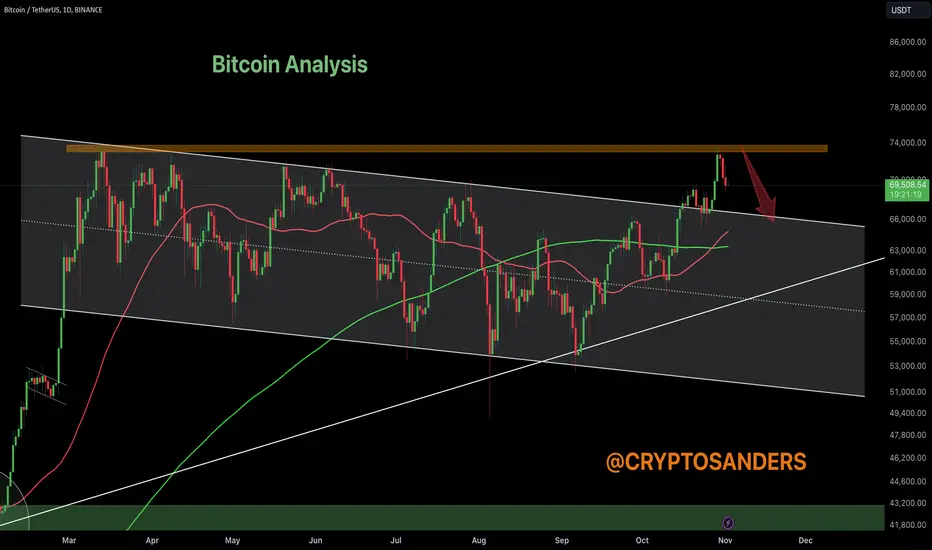
Bitcoin recently tested strong resistance around the $72,000 - $73,000 level, indicated by the orange line. However, it could not break through, and there are signs of a potential pullback.
The red arrow suggests a possible retracement. If Bitcoin fails to regain momentum above this resistance, we could see a correction towards lower support levels, with the $64,000 - $66,000 range as an immediate target.
Bitcoin continues to trade within the descending channel. The channel's lower trendline could serve as support in case of a further pullback, while the upper boundary remains a significant resistance.
The chart shows the moving averages, with Bitcoin currently positioned above the midline support, which may offer some stabilization if prices pull back.
Watch for any clear breakout or sustained rejection around the resistance level to confirm the next trend direction.
Disclaimer: This analysis is for informational purposes and is not financial advice. Always stay updated with market movements and adjust your trading strategies as needed.
You can DM us for information on any other coin.
@Peter_CSAdmin
액티브 트레이드
The situation is still the same for instant BTC, BTC has not shown any major change yet. 
관련 발행물
면책사항
해당 정보와 게시물은 금융, 투자, 트레이딩 또는 기타 유형의 조언이나 권장 사항으로 간주되지 않으며, 트레이딩뷰에서 제공하거나 보증하는 것이 아닙니다. 자세한 내용은 이용 약관을 참조하세요.
관련 발행물
면책사항
해당 정보와 게시물은 금융, 투자, 트레이딩 또는 기타 유형의 조언이나 권장 사항으로 간주되지 않으며, 트레이딩뷰에서 제공하거나 보증하는 것이 아닙니다. 자세한 내용은 이용 약관을 참조하세요.