
🔍 Technical Indicators:
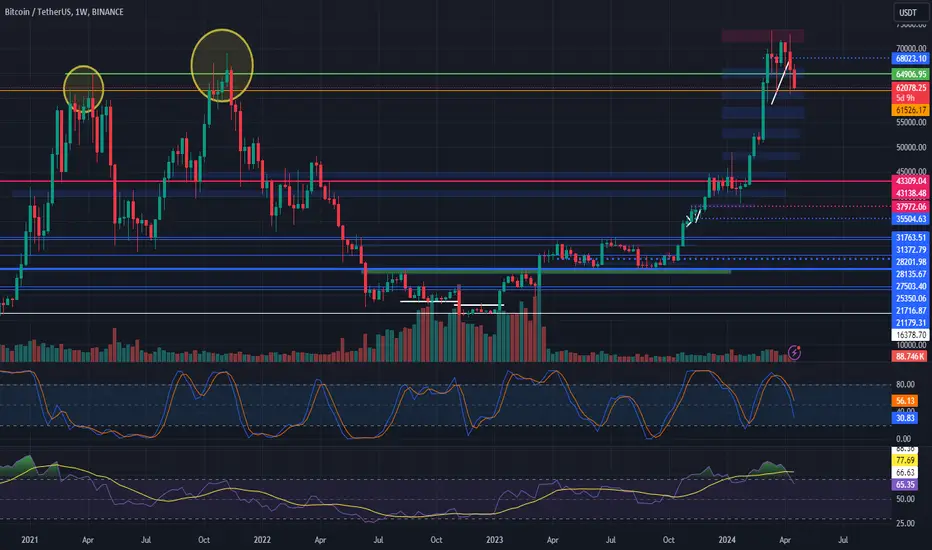
Weekly RSI and Stochastic RSI: Both indicators are indicating a shift in momentum and signaling a reversal, suggesting that Bitcoin is entering a correction phase.
Price Action: Despite rejecting above $72,000, Bitcoin is currently being supported above $61,500 by the bulls. However, a drop below this level could lead to further downside.
🐻 Bearish Scenarios:
Support Levels: If Bitcoin breaks below $61,500, it may encounter support levels at $59,500, $52,000, and potentially $48,000.
Bears in Control: A drop below key support levels could signal increased bearish pressure and potentially lead to further price declines.
Weekly RSI and Stochastic RSI: Both indicators are indicating a shift in momentum and signaling a reversal, suggesting that Bitcoin is entering a correction phase.
Price Action: Despite rejecting above $72,000, Bitcoin is currently being supported above $61,500 by the bulls. However, a drop below this level could lead to further downside.
🐻 Bearish Scenarios:
Support Levels: If Bitcoin breaks below $61,500, it may encounter support levels at $59,500, $52,000, and potentially $48,000.
Bears in Control: A drop below key support levels could signal increased bearish pressure and potentially lead to further price declines.

면책사항
해당 정보와 게시물은 금융, 투자, 트레이딩 또는 기타 유형의 조언이나 권장 사항으로 간주되지 않으며, 트레이딩뷰에서 제공하거나 보증하는 것이 아닙니다. 자세한 내용은 이용 약관을 참조하세요.
면책사항
해당 정보와 게시물은 금융, 투자, 트레이딩 또는 기타 유형의 조언이나 권장 사항으로 간주되지 않으며, 트레이딩뷰에서 제공하거나 보증하는 것이 아닙니다. 자세한 내용은 이용 약관을 참조하세요.