
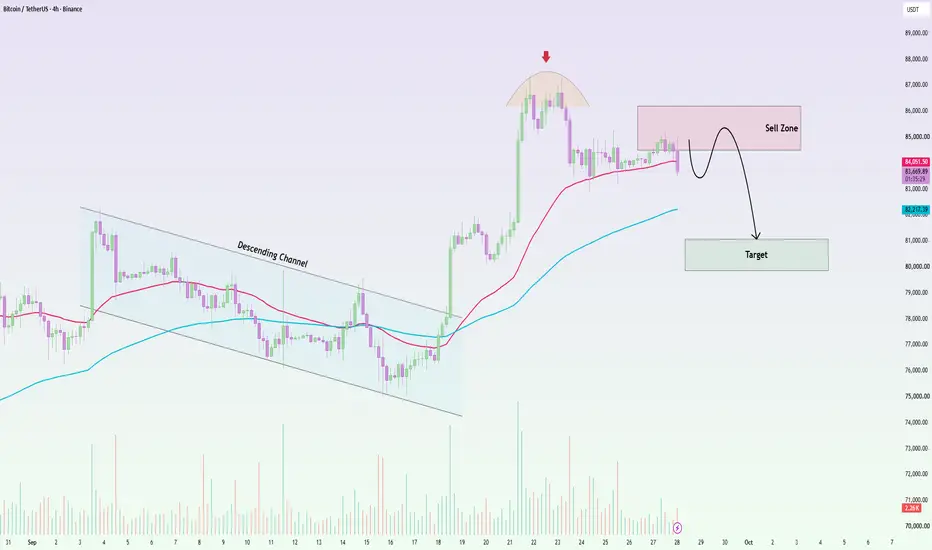
Bitcoin is still holding above the broader breakout structure, but on the H4 chart the current price action looks more like a bearish pause than a fresh continuation higher.
After breaking out of the descending channel, BTC rallied sharply into the 86,500–87,500 area and then started losing momentum. Since that rejection, price has been moving sideways below the top, which suggests buyers are no longer in full control.
The key area now is the 84,500–85,800 sell zone. This zone sits near the short-term recovery area and just above the fast EMA, making it a logical place for sellers to defend. If BTC pushes slightly higher into this zone and gets rejected, the structure would favor another leg down.
From a technical point of view, this setup looks like a pullback into resistance after a local top, with the next downside objective around the 80,200–81,000 region. That target also aligns with the broader support area below and would be a natural place for price to rebalance after the recent rally.
Macro context
The broader macro backdrop also leans bearish for BTC today. A firm USD and elevated US Treasury yields continue to pressure risk assets, which can limit upside momentum in crypto. While ETF demand remains a longer-term support factor, the short-term environment still favors caution on bullish continuation.
Trade idea
Bias: Bearish
Sell zone: 84,500–85,800
Target: 80,200–81,000
Invalidation: A sustained H4 breakout back above 86,000–87,000
For now, I prefer to treat rallies into resistance as selling opportunities rather than chase price higher.
액티브 트레이드

Join our group and unlock real-time Forex, gold, and crypto signals — sharp insights, fast alerts, and opportunities you don’t want to miss.
Join now: t.me/+dfxDTk_DRtg4Mzll
Join now: t.me/+dfxDTk_DRtg4Mzll
관련 발행물
면책사항
해당 정보와 게시물은 금융, 투자, 트레이딩 또는 기타 유형의 조언이나 권장 사항으로 간주되지 않으며, 트레이딩뷰에서 제공하거나 보증하는 것이 아닙니다. 자세한 내용은 이용 약관을 참조하세요.