
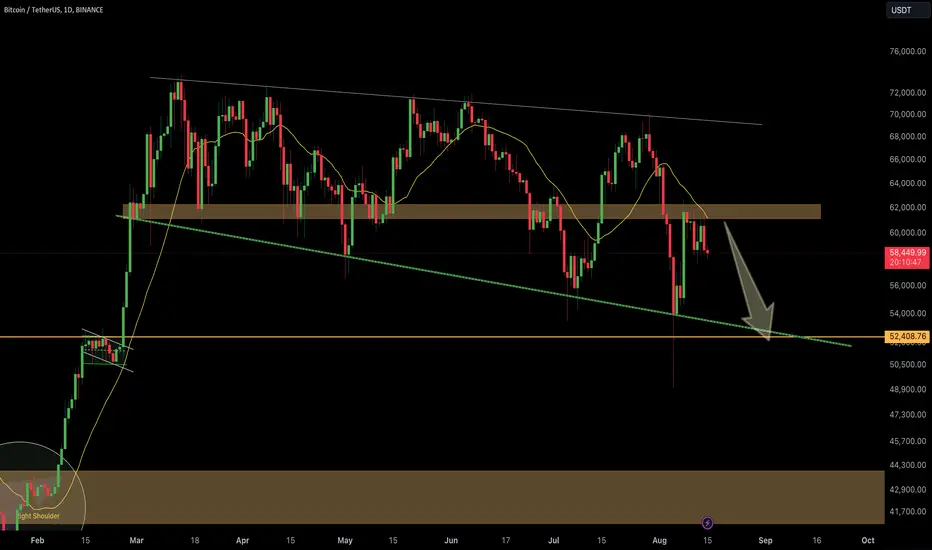
BTC/USDT continues to trade near the 58,409 USDT level, which is a crucial support area. The price is hovering near the bottom of a descending triangle, indicating that this support level is being tested. The green trendline and the 52,408.76 USDT support remain critical levels to watch. A breakdown below this level could lead to further downside momentum, potentially taking BTC towards lower support levels.
On the resistance side, BTC is struggling to reclaim the 60,000 USDT level, and until it breaks above, the bearish trend could continue.
Feel free to ask if you need further details or additional analysis!
Remember: This is not financial advice. Stay tuned to us for further updates and analysis. Thank you!
On the resistance side, BTC is struggling to reclaim the 60,000 USDT level, and until it breaks above, the bearish trend could continue.
Feel free to ask if you need further details or additional analysis!
Remember: This is not financial advice. Stay tuned to us for further updates and analysis. Thank you!

관련 발행물
면책사항
해당 정보와 게시물은 금융, 투자, 트레이딩 또는 기타 유형의 조언이나 권장 사항으로 간주되지 않으며, 트레이딩뷰에서 제공하거나 보증하는 것이 아닙니다. 자세한 내용은 이용 약관을 참조하세요.
관련 발행물
면책사항
해당 정보와 게시물은 금융, 투자, 트레이딩 또는 기타 유형의 조언이나 권장 사항으로 간주되지 않으며, 트레이딩뷰에서 제공하거나 보증하는 것이 아닙니다. 자세한 내용은 이용 약관을 참조하세요.