
Hello, welcome to this BITCOIN update by CRYPTO SANDERS.
CHART ANALYSIS:- Current Market Status
At the halfway point of May, bitcoin has fallen to a two-month low, as market sentiment shifted bearish, following April’s strong gains.
With several key data points all being released in a short window, it was somewhat expected that price uncertainty would be present.
The Fed increased interest rates by 25 basis points, days after non-farm payrolls rose to 253,000, versus expectations of 180,000.
Since then, inflation fell to 4.9% in April, with many still uncertain as to what the Federal Reserve will do during June’s meeting.
May Outlook
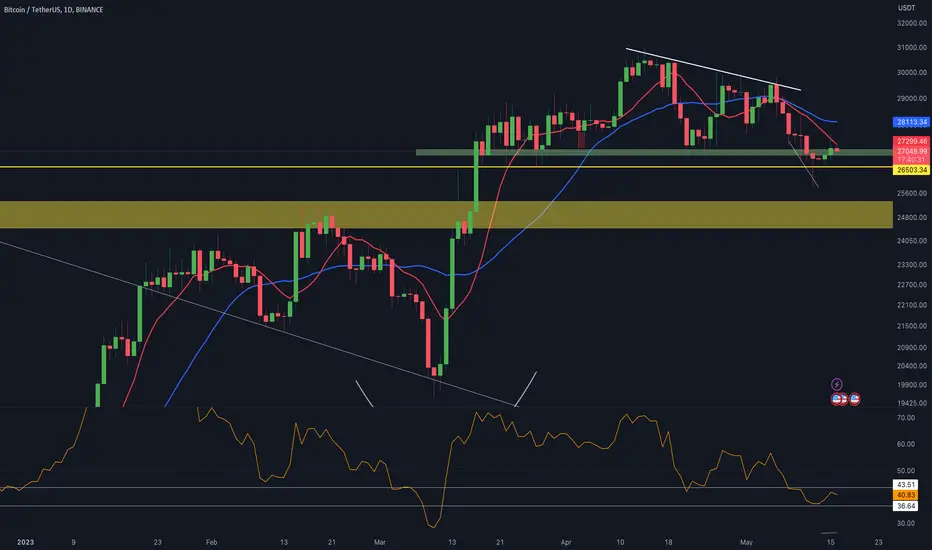
Bitcoin (BTC) fell to a low of 25,810 last Friday, which came after a breakout occurred at a key price floor of 26,500.
This move saw the world’s largest cryptocurrency plunge to its weakest point since March 17, when the price was below $25,000.
Since then, BTC has somewhat rebounded, climbing to a peak of 27,527.51 earlier in today’s session.
From the chart, one of the catalysts for this move was the 14-day relative strength index (RSI), which rose above a ceiling of 42.00.
The index is now tracking at 44.66, with Bitcoin reentering its own support point at 27,500, with bulls seemingly targeting 28,000 in the near term.
A big test will be what happens when the RSI reaches a ceiling at 48.00, should it move beyond this, not only will BTC be above 28,000, but, there is a good chance that it could hit 30,000 before the month’s end.
I have tried to bring the best possible outcome to this chart.
Hit the like button if you like it and share your charts in the comments section.
Thank you
CHART ANALYSIS:- Current Market Status
At the halfway point of May, bitcoin has fallen to a two-month low, as market sentiment shifted bearish, following April’s strong gains.
With several key data points all being released in a short window, it was somewhat expected that price uncertainty would be present.
The Fed increased interest rates by 25 basis points, days after non-farm payrolls rose to 253,000, versus expectations of 180,000.
Since then, inflation fell to 4.9% in April, with many still uncertain as to what the Federal Reserve will do during June’s meeting.
May Outlook
Bitcoin (BTC) fell to a low of 25,810 last Friday, which came after a breakout occurred at a key price floor of 26,500.
This move saw the world’s largest cryptocurrency plunge to its weakest point since March 17, when the price was below $25,000.
Since then, BTC has somewhat rebounded, climbing to a peak of 27,527.51 earlier in today’s session.
From the chart, one of the catalysts for this move was the 14-day relative strength index (RSI), which rose above a ceiling of 42.00.
The index is now tracking at 44.66, with Bitcoin reentering its own support point at 27,500, with bulls seemingly targeting 28,000 in the near term.
A big test will be what happens when the RSI reaches a ceiling at 48.00, should it move beyond this, not only will BTC be above 28,000, but, there is a good chance that it could hit 30,000 before the month’s end.
I have tried to bring the best possible outcome to this chart.
Hit the like button if you like it and share your charts in the comments section.
Thank you

관련 발행물
면책사항
해당 정보와 게시물은 금융, 투자, 트레이딩 또는 기타 유형의 조언이나 권장 사항으로 간주되지 않으며, 트레이딩뷰에서 제공하거나 보증하는 것이 아닙니다. 자세한 내용은 이용 약관을 참조하세요.
관련 발행물
면책사항
해당 정보와 게시물은 금융, 투자, 트레이딩 또는 기타 유형의 조언이나 권장 사항으로 간주되지 않으며, 트레이딩뷰에서 제공하거나 보증하는 것이 아닙니다. 자세한 내용은 이용 약관을 참조하세요.