
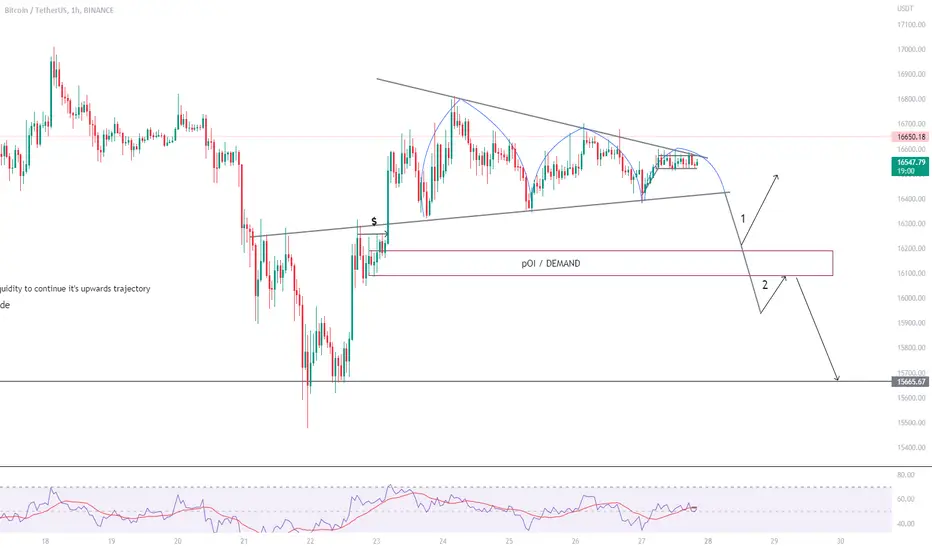
1- The triple top is a chart pattern used in technical analysis to predict a reversal in the price movement of an asset. A triple top indicates that the asset is no longer rallying and that lower prices are expected.
2- We have a level of demand below it, so the price must come to that level and have a big bounce to continue rising.
3- In scenario 2, the price will break the demand, retest it, and then continue to the lower resistance, where it will consolidate, then reach the 12 k area due to market fear.
2- We have a level of demand below it, so the price must come to that level and have a big bounce to continue rising.
3- In scenario 2, the price will break the demand, retest it, and then continue to the lower resistance, where it will consolidate, then reach the 12 k area due to market fear.

면책사항
해당 정보와 게시물은 금융, 투자, 트레이딩 또는 기타 유형의 조언이나 권장 사항으로 간주되지 않으며, 트레이딩뷰에서 제공하거나 보증하는 것이 아닙니다. 자세한 내용은 이용 약관을 참조하세요.
면책사항
해당 정보와 게시물은 금융, 투자, 트레이딩 또는 기타 유형의 조언이나 권장 사항으로 간주되지 않으며, 트레이딩뷰에서 제공하거나 보증하는 것이 아닙니다. 자세한 내용은 이용 약관을 참조하세요.