
BTC is looking delicious these days, sidelined money is slowly coming back to the market as we all feel bullish these days but when will it stop? Or will it stop anyways?
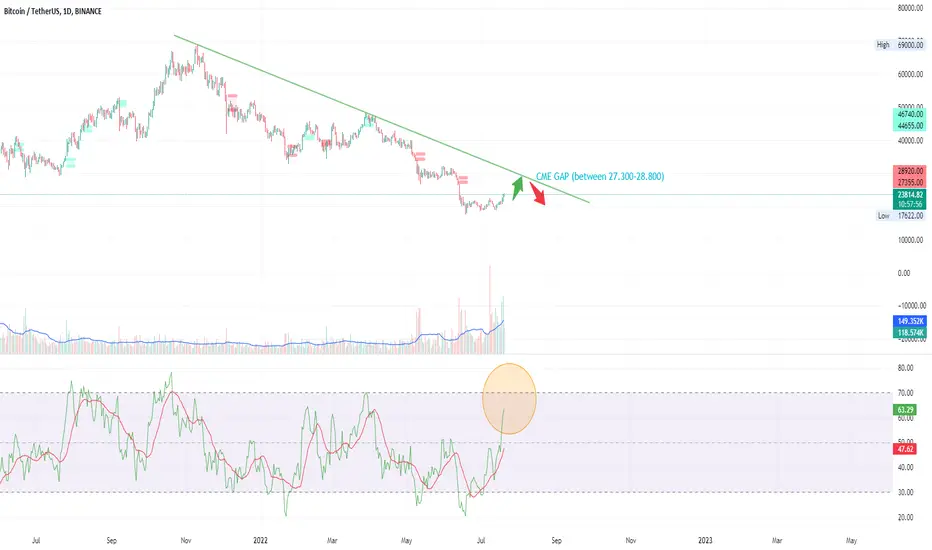
As we all know that BTC likes to fill the CME gap. The nearest CME gap is between 27.3-28.8k.
If you look at the chart if BTC continues to go up it will meet the downtrend line which is from November 2021 at the same levels of CME gap. What a coincidence?
If you look at the daily RSI chart when it reaches to 70 level BTC makes downside correction moves so around 28k daily RSI will be 70..
So what these data tell us?
I think 28k is a good price to take profit and I think we will see a final leg down may be to the 16-18k after this 28k movement..

면책사항
해당 정보와 게시물은 금융, 투자, 트레이딩 또는 기타 유형의 조언이나 권장 사항으로 간주되지 않으며, 트레이딩뷰에서 제공하거나 보증하는 것이 아닙니다. 자세한 내용은 이용 약관을 참조하세요.
면책사항
해당 정보와 게시물은 금융, 투자, 트레이딩 또는 기타 유형의 조언이나 권장 사항으로 간주되지 않으며, 트레이딩뷰에서 제공하거나 보증하는 것이 아닙니다. 자세한 내용은 이용 약관을 참조하세요.