
Hello to all members of TradingView and my followers.
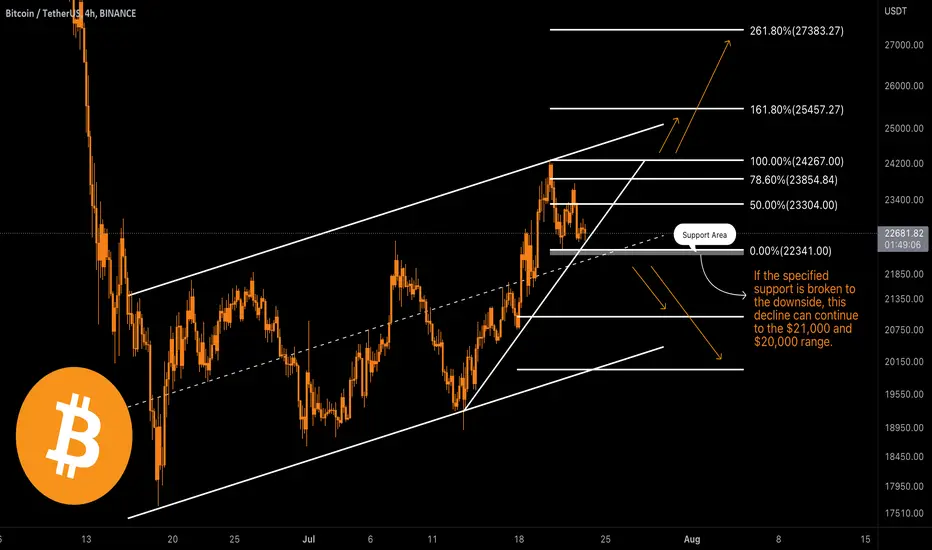
The Bitcoin chart in the last 24 hours has witnessed the registration of a daily range candle within the range of its previous candles. The previous day's upward movement was made up to the resistance of $23,800, and in this area, due to the negative reaction and selling pressure, the price returned to the support of $22,600. This reversal was accompanied by a steep downward slope and occurred in less than 5 hours. A large bullish channel is considered for Bitcoin in the 4-hour time frame. If the specified support is broken to the downside, this decline can continue to the $21,000 and $20,000 range.
If it is helpful to you, please like it. If you have a comment, I'll be happy to know. Respectfully.
The Bitcoin chart in the last 24 hours has witnessed the registration of a daily range candle within the range of its previous candles. The previous day's upward movement was made up to the resistance of $23,800, and in this area, due to the negative reaction and selling pressure, the price returned to the support of $22,600. This reversal was accompanied by a steep downward slope and occurred in less than 5 hours. A large bullish channel is considered for Bitcoin in the 4-hour time frame. If the specified support is broken to the downside, this decline can continue to the $21,000 and $20,000 range.
If it is helpful to you, please like it. If you have a comment, I'll be happy to know. Respectfully.

Join the free Telegram channel
💎 Telegram Channel: t.me/MonoCoin_Public
🔔 Bot: t.me/MonoCoinSignal_Bot?start=starter_tv
🌐 Website: MonoCoin.net
⭐️ 5-Star TrustPilot: trustpilot.com/review/monocoin.net
💎 Telegram Channel: t.me/MonoCoin_Public
🔔 Bot: t.me/MonoCoinSignal_Bot?start=starter_tv
🌐 Website: MonoCoin.net
⭐️ 5-Star TrustPilot: trustpilot.com/review/monocoin.net
관련 발행물
면책사항
해당 정보와 게시물은 금융, 투자, 트레이딩 또는 기타 유형의 조언이나 권장 사항으로 간주되지 않으며, 트레이딩뷰에서 제공하거나 보증하는 것이 아닙니다. 자세한 내용은 이용 약관을 참조하세요.
Join the free Telegram channel
💎 Telegram Channel: t.me/MonoCoin_Public
🔔 Bot: t.me/MonoCoinSignal_Bot?start=starter_tv
🌐 Website: MonoCoin.net
⭐️ 5-Star TrustPilot: trustpilot.com/review/monocoin.net
💎 Telegram Channel: t.me/MonoCoin_Public
🔔 Bot: t.me/MonoCoinSignal_Bot?start=starter_tv
🌐 Website: MonoCoin.net
⭐️ 5-Star TrustPilot: trustpilot.com/review/monocoin.net
관련 발행물
면책사항
해당 정보와 게시물은 금융, 투자, 트레이딩 또는 기타 유형의 조언이나 권장 사항으로 간주되지 않으며, 트레이딩뷰에서 제공하거나 보증하는 것이 아닙니다. 자세한 내용은 이용 약관을 참조하세요.