
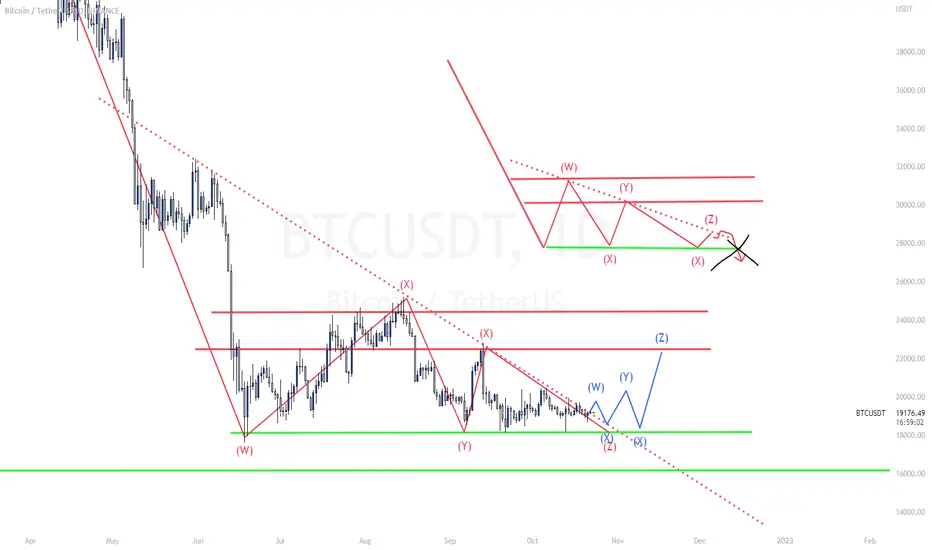
A descending triangle has formed on the Bitcoin chart, this is a pattern of the continuation of the downward trend, and many expect it to be broken. However, in our case, it is possible to work in the opposite direction, and here's why.
I think several large traders have been gaining positions for 5 months already, at the levels of 18000-20000, and in order for them to gain a position, they should create sawtooth movements, i.e. false breakouts up and down. As a result of such actions on the chart, the descending triangle should become a rectangle with sides 18.000 - 22.500 (25.000) . At some point, it is likely that the price will follow the stops to the level of 16.000.
My opinion is that bitcoin is in accumulation, and this is a good sign of further rapid growth, under fundamental economic and other conditions.
I think several large traders have been gaining positions for 5 months already, at the levels of 18000-20000, and in order for them to gain a position, they should create sawtooth movements, i.e. false breakouts up and down. As a result of such actions on the chart, the descending triangle should become a rectangle with sides 18.000 - 22.500 (25.000) . At some point, it is likely that the price will follow the stops to the level of 16.000.
My opinion is that bitcoin is in accumulation, and this is a good sign of further rapid growth, under fundamental economic and other conditions.
노트
the idea is in force, they broke through 21.000 and there is no rollback, the instrument should go higher to the level of 23.000

Хочешь хороших денег – умей выжидать
면책사항
해당 정보와 게시물은 금융, 투자, 트레이딩 또는 기타 유형의 조언이나 권장 사항으로 간주되지 않으며, 트레이딩뷰에서 제공하거나 보증하는 것이 아닙니다. 자세한 내용은 이용 약관을 참조하세요.
Хочешь хороших денег – умей выжидать
면책사항
해당 정보와 게시물은 금융, 투자, 트레이딩 또는 기타 유형의 조언이나 권장 사항으로 간주되지 않으며, 트레이딩뷰에서 제공하거나 보증하는 것이 아닙니다. 자세한 내용은 이용 약관을 참조하세요.