
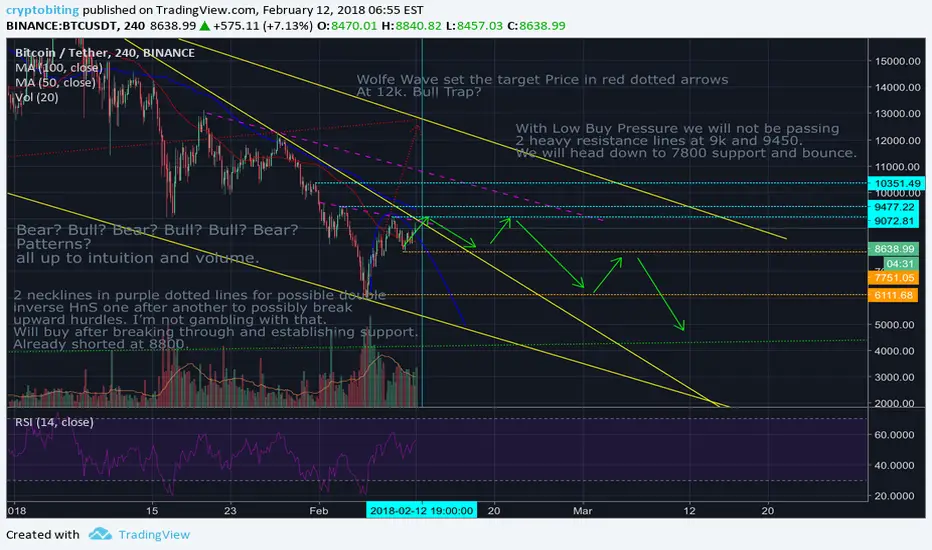
Up until this point, Bulls have rallied up without much pressure. Bears were hibernating.
Could this be a bull trap like other bubble formations? Or a bear trap? The line intersections and signs of both were clear. Very confusing. In a previous post I mentioned something peculiar about Feb 12th. Why all signs pointed to today.
Let’s see.
I played defense a shorted BTC and ETH at 8800.
If it rallies past the hurdles and establishes support, will be back in, but
I’ve mentally settled for more predictable swing trades and go long with cheaper coins at the bottom.
Could this be a bull trap like other bubble formations? Or a bear trap? The line intersections and signs of both were clear. Very confusing. In a previous post I mentioned something peculiar about Feb 12th. Why all signs pointed to today.
Let’s see.
I played defense a shorted BTC and ETH at 8800.
If it rallies past the hurdles and establishes support, will be back in, but
I’ve mentally settled for more predictable swing trades and go long with cheaper coins at the bottom.
액티브 트레이드
My guess is it’s going to hit 10k resistance then back to 9k support and then create the bigger inverse head n Shoulders which should generate even bigger volume for a possible breakout. If this happens Alt coins will be powered up again for bigger profit gains.액티브 트레이드
Neckline hit and found resistance at 10.3K.Let’s go for 11.5k trendline before our 5th wave down..

면책사항
해당 정보와 게시물은 금융, 투자, 트레이딩 또는 기타 유형의 조언이나 권장 사항으로 간주되지 않으며, 트레이딩뷰에서 제공하거나 보증하는 것이 아닙니다. 자세한 내용은 이용 약관을 참조하세요.
면책사항
해당 정보와 게시물은 금융, 투자, 트레이딩 또는 기타 유형의 조언이나 권장 사항으로 간주되지 않으며, 트레이딩뷰에서 제공하거나 보증하는 것이 아닙니다. 자세한 내용은 이용 약관을 참조하세요.