
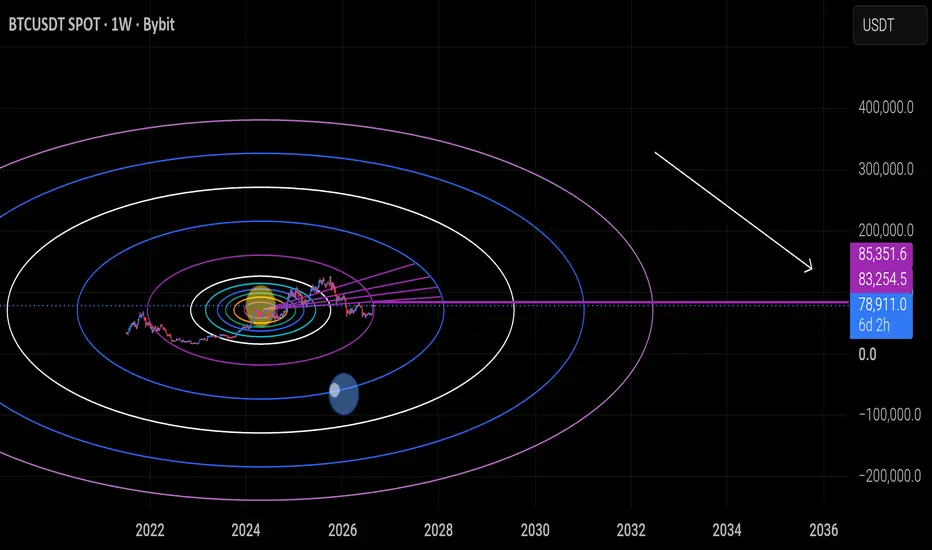
🚀 BTC 2-Week MACD Bullish Cross — Is the Bull Run Starting?
One of the most interesting signals I like to watch for the beginning of a major Bitcoin bull run is the MACD bullish crossover on the 2-week timeframe.
Historically, whenever we see this kind of crossover on the 2-week chart, it can mark the beginning of a new bullish cycle and a potentially much larger move to the upside. 📈🔥
And now, BTC has finally printed a bullish MACD crossover on the 2-week timeframe.
This is a very important signal for me, especially when combined with the overall market structure and price action.
🎯 My current targets:
Target 1: The first target shown on the chart
Target 2: $83,260
Target 3: $85,350
If Bitcoin continues to hold its bullish structure and momentum remains strong, I believe these levels could become important areas to watch as the move develops.
Of course, the MACD crossover alone doesn't guarantee a straight move up. We still need to monitor price action, volume, support levels, and potential pullbacks along the way.
But from a higher-timeframe perspective, this crossover is definitely something bulls should pay attention to. 👀
BTC may be entering the early stages of another major bullish expansion. 🚀
Let’s see how price reacts as we approach the targets.
Not financial advice. DYOR and always manage your risk.

면책사항
해당 정보와 게시물은 금융, 투자, 트레이딩 또는 기타 유형의 조언이나 권장 사항으로 간주되지 않으며, 트레이딩뷰에서 제공하거나 보증하는 것이 아닙니다. 자세한 내용은 이용 약관을 참조하세요.
면책사항
해당 정보와 게시물은 금융, 투자, 트레이딩 또는 기타 유형의 조언이나 권장 사항으로 간주되지 않으며, 트레이딩뷰에서 제공하거나 보증하는 것이 아닙니다. 자세한 내용은 이용 약관을 참조하세요.