
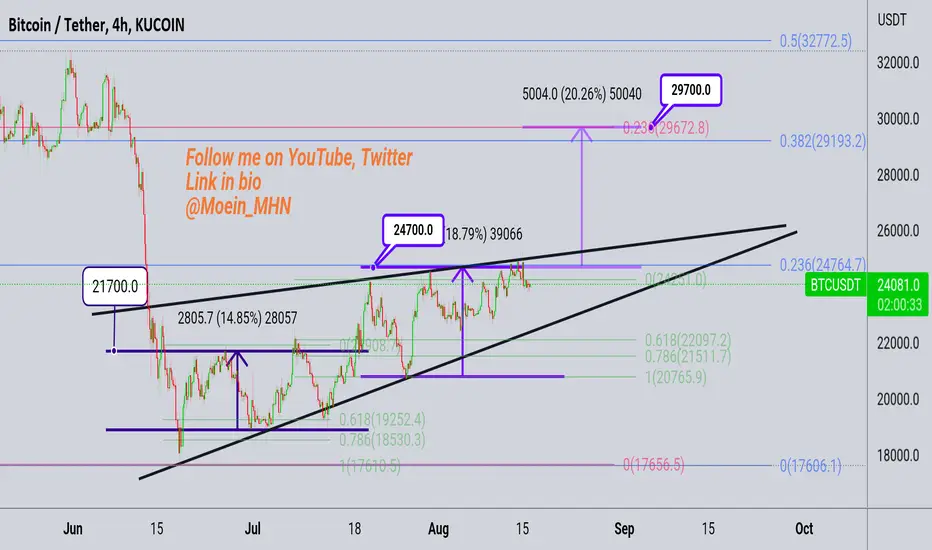
Hi guys. Bitcoin daily and 4 hour time frame
If you look closely, from January 14 to July 18, it was in a trading range between $18,850 and $21,700. And after exiting with a powerful candle in daily time and consolidation, the uptrend continued to the 24700 range.
And now it looks like we are back in the trading range between $20,700 and $24,700.
And you should see on the Fibonacci numbers chart that I drew a fibo from $69,000 and $48,000 to the level that Bitcoin saw, which is $17,600. And we see that the 0.236 Fibo, which is the $24,760 range, is currently showing resistance.
Overall, if we break out of this range, we can see Bitcoin rise to $29,200 and $29,700.
At $29,700, there are important static resistances and important Fibo numbers are also placed (0.382 and 0.0236).
And I think the trend could be bullish as long as we stay above 20,700
Good luck
Like and comment please ❤️

관련 발행물
면책사항
해당 정보와 게시물은 금융, 투자, 트레이딩 또는 기타 유형의 조언이나 권장 사항으로 간주되지 않으며, 트레이딩뷰에서 제공하거나 보증하는 것이 아닙니다. 자세한 내용은 이용 약관을 참조하세요.
면책사항
해당 정보와 게시물은 금융, 투자, 트레이딩 또는 기타 유형의 조언이나 권장 사항으로 간주되지 않으며, 트레이딩뷰에서 제공하거나 보증하는 것이 아닙니다. 자세한 내용은 이용 약관을 참조하세요.