
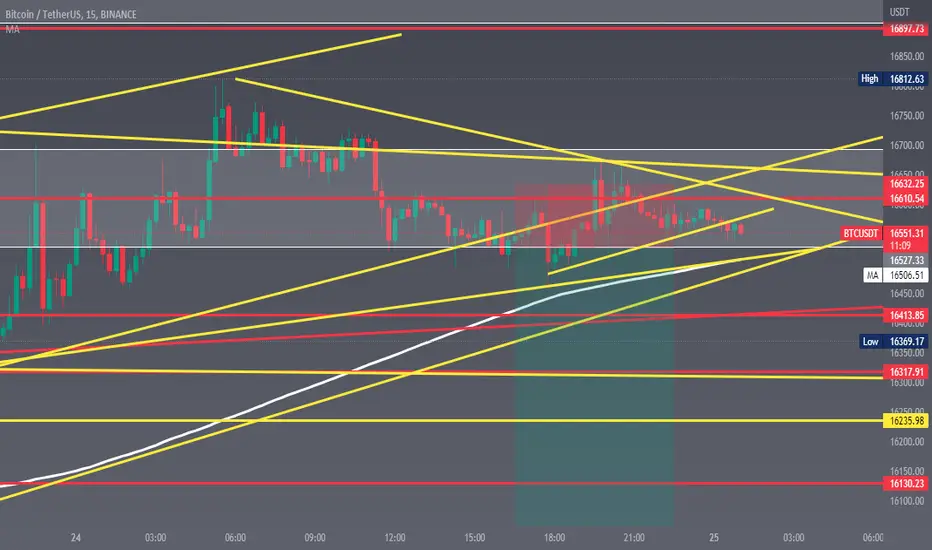
BTC New Target
Bear vs Bull
Once again we look at Bitcoin (XBT) short-term.
We have a recent bullish move... What happens next?
Above the blue and grey lines the bullish move can continue.
Immediate resistance is also found at the black line or MA200 ($16,483).
Looking at these three levels, XBT needs to move above the $16,500/$16,850 price range to knock out the bears.
Any trading below the blue line (~$16,615) can keep the bears alive and the drop resume.
If this level are conquered, then the balls passes towards the bulls.
More details on the chart.
Still red...
Namaste.

면책사항
해당 정보와 게시물은 금융, 투자, 트레이딩 또는 기타 유형의 조언이나 권장 사항으로 간주되지 않으며, 트레이딩뷰에서 제공하거나 보증하는 것이 아닙니다. 자세한 내용은 이용 약관을 참조하세요.
면책사항
해당 정보와 게시물은 금융, 투자, 트레이딩 또는 기타 유형의 조언이나 권장 사항으로 간주되지 않으며, 트레이딩뷰에서 제공하거나 보증하는 것이 아닙니다. 자세한 내용은 이용 약관을 참조하세요.