
Is Bitcoin's "bottom" reached?
Bitcoin Descending Triangle Analysis 🔥
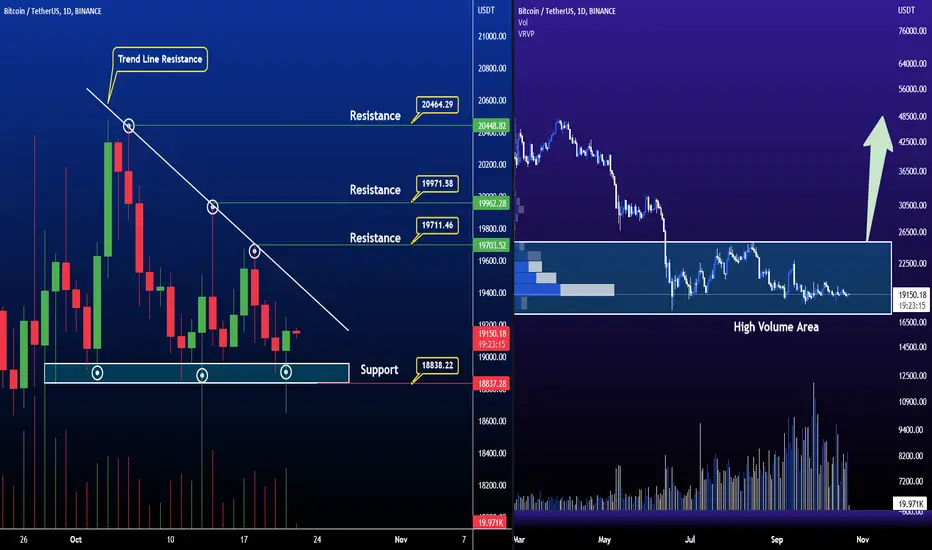
The above chart of Bitcoin ( BTCUSDT ) laid out the descending triangle pattern. This pattern is often regarded as a characteristic of a bearish trend . It is formed by the upper trend line that connects the highs and a horizontal trend line connecting lows converges to form a triangle. If the price action breaches the lower support level , the bearish trend would be sustained.
Currently, Bitcoin ( BTCUSDT ) is in the range of $ 19150. If the pattern continues, the price of Bitcoin ( BTCUSDT ) might reach the support levels of $20000, If the trend reverses, then the price of Bitcoin ( BTCUSDT ) may rise to $18800
Volume Profile View - Good volume has been added at the bottom level
Hope for recovery
Happy Trading
Bitcoin Descending Triangle Analysis 🔥
The above chart of Bitcoin ( BTCUSDT ) laid out the descending triangle pattern. This pattern is often regarded as a characteristic of a bearish trend . It is formed by the upper trend line that connects the highs and a horizontal trend line connecting lows converges to form a triangle. If the price action breaches the lower support level , the bearish trend would be sustained.
Currently, Bitcoin ( BTCUSDT ) is in the range of $ 19150. If the pattern continues, the price of Bitcoin ( BTCUSDT ) might reach the support levels of $20000, If the trend reverses, then the price of Bitcoin ( BTCUSDT ) may rise to $18800
Volume Profile View - Good volume has been added at the bottom level
Hope for recovery
Happy Trading
액티브 트레이드
거래청산: 타겟 닿음
Perfect Trade노트
Agreed
관련 발행물
면책사항
해당 정보와 게시물은 금융, 투자, 트레이딩 또는 기타 유형의 조언이나 권장 사항으로 간주되지 않으며, 트레이딩뷰에서 제공하거나 보증하는 것이 아닙니다. 자세한 내용은 이용 약관을 참조하세요.
관련 발행물
면책사항
해당 정보와 게시물은 금융, 투자, 트레이딩 또는 기타 유형의 조언이나 권장 사항으로 간주되지 않으며, 트레이딩뷰에서 제공하거나 보증하는 것이 아닙니다. 자세한 내용은 이용 약관을 참조하세요.