
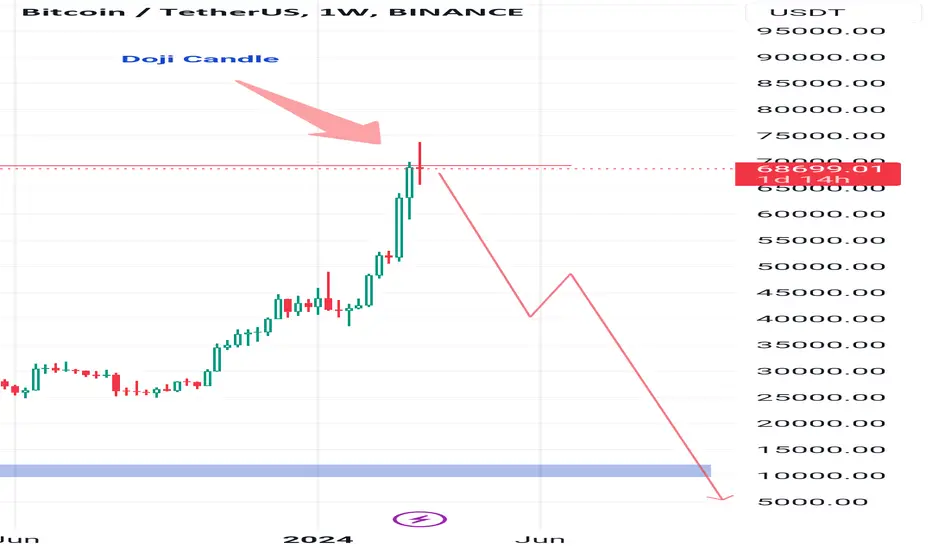
Supply Zone:
A supply zone occurs when the supply of a cryptocurrency exceeds the demand.
In this area, there is excess supply, leading to a falling price.
On a price chart, a supply zone is associated with a downtrend.
Traders often place sell orders in supply zones, expecting prices to decline further.
Imp : forming doji candles in weekly chart
Interpreting Doji Patterns:
Bearish Doji: When a Doji forms at a resistance area, it can signal indecision or a potential trend reversal.
However, the context matters:
If the preceding trend is upward, a bearish Doji may indicate a reversal.
If the preceding trend is downward, it could reinforce the existing bearish sentiment.
A supply zone occurs when the supply of a cryptocurrency exceeds the demand.
In this area, there is excess supply, leading to a falling price.
On a price chart, a supply zone is associated with a downtrend.
Traders often place sell orders in supply zones, expecting prices to decline further.
Imp : forming doji candles in weekly chart
Interpreting Doji Patterns:
Bearish Doji: When a Doji forms at a resistance area, it can signal indecision or a potential trend reversal.
However, the context matters:
If the preceding trend is upward, a bearish Doji may indicate a reversal.
If the preceding trend is downward, it could reinforce the existing bearish sentiment.

면책사항
해당 정보와 게시물은 금융, 투자, 트레이딩 또는 기타 유형의 조언이나 권장 사항으로 간주되지 않으며, 트레이딩뷰에서 제공하거나 보증하는 것이 아닙니다. 자세한 내용은 이용 약관을 참조하세요.
면책사항
해당 정보와 게시물은 금융, 투자, 트레이딩 또는 기타 유형의 조언이나 권장 사항으로 간주되지 않으며, 트레이딩뷰에서 제공하거나 보증하는 것이 아닙니다. 자세한 내용은 이용 약관을 참조하세요.