
👋Hi everyone.
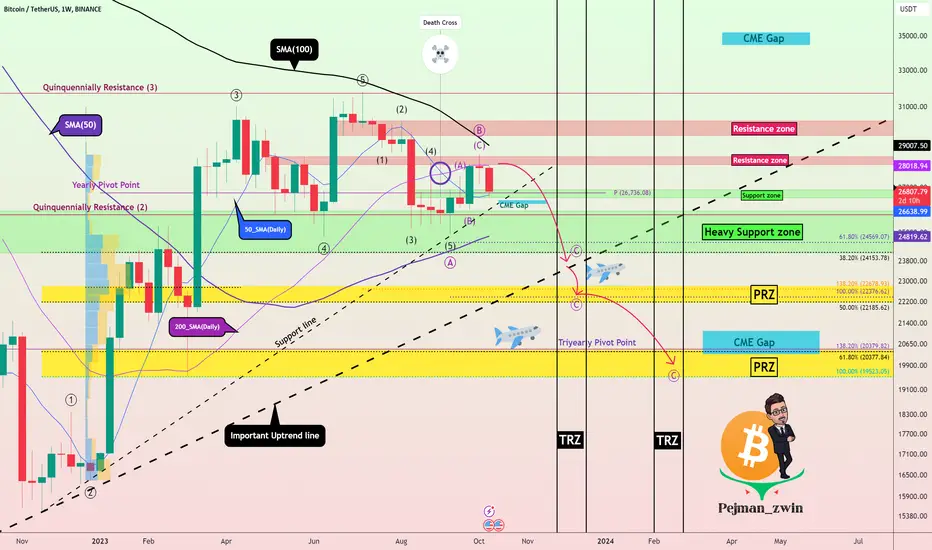
📈Today, I decided to analyze Bitcoin almost completely on a weekly time frame with the help of technical analysis tools to give you a good view for the mid-term.
✅After rising almost ➕15% for the past four weeks, Bitcoin has started to decline again (as I expected in previous posts✅).
☠️One of the reasons for Bitcoin's fall again in terms of technical analysis was the Death Cross Signal.
📚☠️Death Cross Signal☠️: The death cross appears on a chart when an asset's short-term Moving Average(MA), usually the 50-day, crosses below its long-term moving average, usually the 200-day.
🌊According to Elliott's wave theory, Bitcoin completed its 5-impulse wave at $31,800 and is currently completing corrective waves. It is better to know that because the main wave A has 5 microwaves, the structure of the corrective pattern should be in the form of a Zigzag correction(ABC/5-3-5).
🌊It seems that the main wave B has also ended, but to confirm this, we have to wait for the break of the Support line and the 🟢Support zone($26,880-$26,500)🟢.
🌊After confirmation of the end of the main wave B, I expect the main wave C to finish in the 🟢Heavy Support zone($25,280-$23,900)🟢 or one of the 🟡Price Reversal Zones(PRZs)🟡, in terms of timing, the end of the main wave C could be in one of the ⚫️Time Reversal Zones(TRZs)⚫️.
❗️Note❗️: The price and time of the end of the main wave C depends on the fundamental conditions of the cryptocurrency market and other parameters (💲Interest rate💲_⚔️War⚔️_🐳Behavior of whales🐳_🔄On-chain Data🔄_etc.)
🔔I expect Bitcoin to rise to at least the previous high($31,800) after the correction waves are completed.
🙏In the end, I have to apologize for the fact that the chart is busy, but in my opinion, all the lines and indicators were needed for your better understanding of the analysis, and I also hope that this analysis has an 📚educational📚 aspect for you.
------------------------------------------------------------
I would be happy to share your opinion about Bitcoin for the mid and even long-term below this post.
------------------------------------------------------------
Bitcoin Analyze ( BTCUSDT ), Weekly time frame ⏰.
Do not forget to put Stop loss for your positions (For every position you want to open).
Please follow your strategy; this is just my Idea, and I will gladly see your ideas in this post.
Please do not forget the ✅' like'✅ button 🙏😊 & Share it with your friends; thanks, and Trade safe.
노트
The last 3 weekly candles can also create an 💫Evening Star Candlestick Pattern💫, but we have to wait for two more days.액티브 트레이드
노트
We still can't confirm the end of the main wave B, I will update this post after confirmation.
🎁 Free Real VIP Forex and Crypto Signals. Please visit:
🔗 t.me/ProTrader_365
🔗 t.me/ProTrader_365
관련 발행물
면책사항
해당 정보와 게시물은 금융, 투자, 트레이딩 또는 기타 유형의 조언이나 권장 사항으로 간주되지 않으며, 트레이딩뷰에서 제공하거나 보증하는 것이 아닙니다. 자세한 내용은 이용 약관을 참조하세요.
🎁 Free Real VIP Forex and Crypto Signals. Please visit:
🔗 t.me/ProTrader_365
🔗 t.me/ProTrader_365
관련 발행물
면책사항
해당 정보와 게시물은 금융, 투자, 트레이딩 또는 기타 유형의 조언이나 권장 사항으로 간주되지 않으며, 트레이딩뷰에서 제공하거나 보증하는 것이 아닙니다. 자세한 내용은 이용 약관을 참조하세요.