
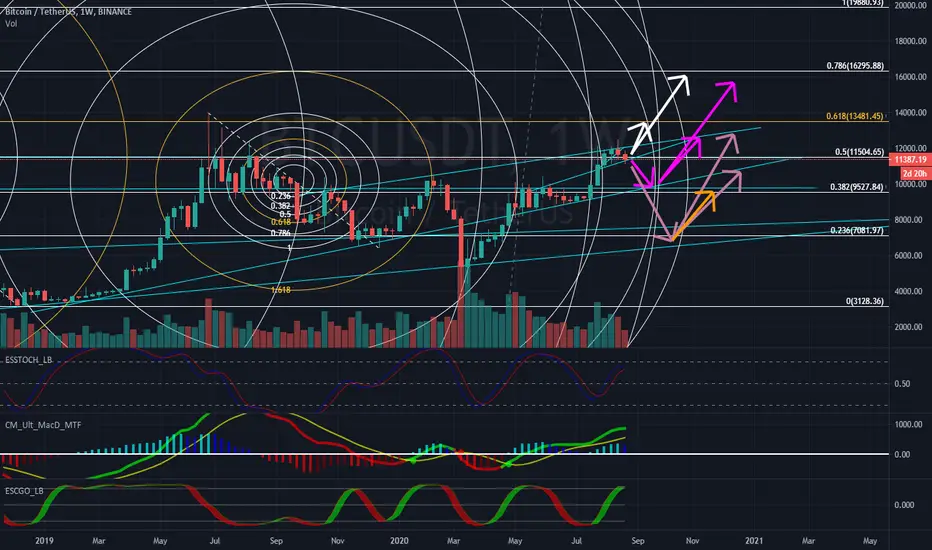
Currently we are either breaking out downward(weekly) or correcting back up into structure(via daily). The weekly candle close will determine is we have broken out of the current structure downward; however, BTC is currently correcting back into the structure as the weekly close approaches.
Weekly indicators:
IF weekly downward breakout holds until close.
Pink: Most plausible in my opinion.
Burnt Orange: Second most plausible according to indicators.
Daily Indicators:
IF weekly closes inside the structure.
White: Looking at the daily this seems to be a fairly likely outcome.
I apologize that my work is messy! Any feedback is appreciated and I hope this helps someone!!
Note: Arrows are not drawn to scale with respect to time, just a general guess of the path it will take price wise.
노트
Seems to be following the expected path. (Pink)
면책사항
해당 정보와 게시물은 금융, 투자, 트레이딩 또는 기타 유형의 조언이나 권장 사항으로 간주되지 않으며, 트레이딩뷰에서 제공하거나 보증하는 것이 아닙니다. 자세한 내용은 이용 약관을 참조하세요.
면책사항
해당 정보와 게시물은 금융, 투자, 트레이딩 또는 기타 유형의 조언이나 권장 사항으로 간주되지 않으며, 트레이딩뷰에서 제공하거나 보증하는 것이 아닙니다. 자세한 내용은 이용 약관을 참조하세요.