
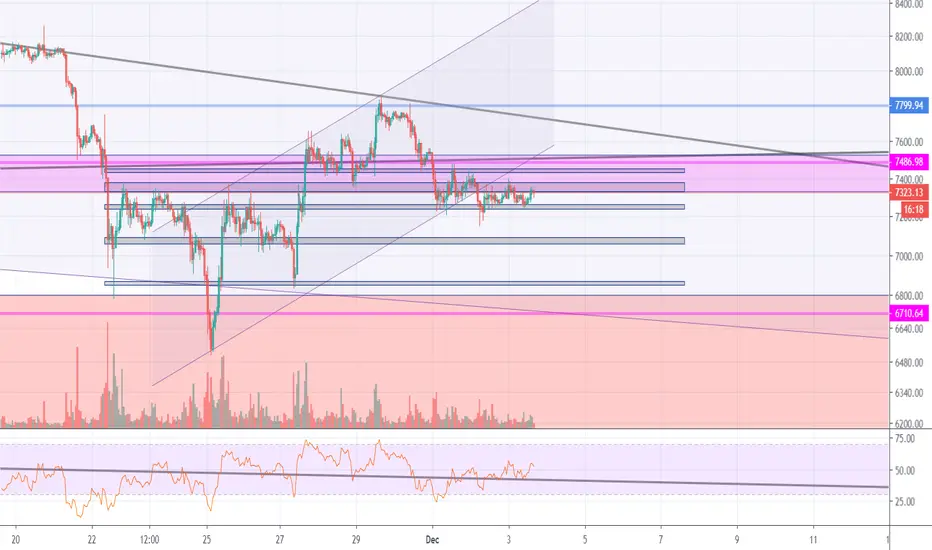
Hey, everybody, I'm the developer of an artificial intelligence buy-sell robot called Mikabot. In the light of the information provided by the new "Channel Bender" module, I added dark horizontal areas to the chart.
You see the dark horizontal areas in the graph.
These areas work as a trend and are the resistance and support of the channels.
The price of Bitcoin will probably find the new direction trapped between these trends.
Let's see what happens.
You see the dark horizontal areas in the graph.
These areas work as a trend and are the resistance and support of the channels.
The price of Bitcoin will probably find the new direction trapped between these trends.
Let's see what happens.

관련 발행물
면책사항
해당 정보와 게시물은 금융, 투자, 트레이딩 또는 기타 유형의 조언이나 권장 사항으로 간주되지 않으며, 트레이딩뷰에서 제공하거나 보증하는 것이 아닙니다. 자세한 내용은 이용 약관을 참조하세요.
면책사항
해당 정보와 게시물은 금융, 투자, 트레이딩 또는 기타 유형의 조언이나 권장 사항으로 간주되지 않으며, 트레이딩뷰에서 제공하거나 보증하는 것이 아닙니다. 자세한 내용은 이용 약관을 참조하세요.