
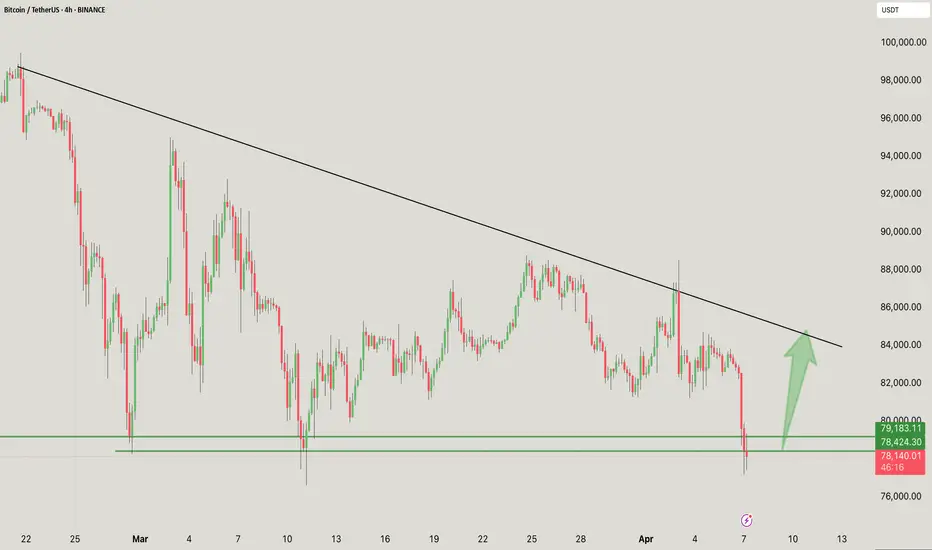
Current Price: ~$78,336
BTC has broken below the symmetrical triangle and is testing the key horizontal support between $78,424 and $79,183.
A wick is visible below the support, but the candle closed within the area, indicating a potential fakeout or demand absorption.
Resistance (downtrend line): ~$85,500
Support Zones:
Primary: $78,424
Secondary: $79,183
Immediate Resistance: $82,000 – $83,000 (recent breakdown zone)
Outlook & Scenarios:
Bullish Reversal Scenario (Green Arrow):
The green arrow projection suggests a potential bounce from this demand zone.
If BTC reclaims $80K+ with strong momentum, it could aim for the descending trendline near $85K.
A bullish confirmation would be a 4H candle close above $80.5K–$81K.
Bearish continuation (if support fails):
If the price fails to hold this support zone, the next downside targets could be:
$76,000
$73,500
Sentiment factor:
The previous sentiment (Fear & Greed Index: 28 – Fear) reflects ongoing market caution.
Price action near key support in the fear zone could trigger a short squeeze or panic sell-off, depending on volume and reaction.
Summary:
BTC is at crucial support, and unless volume confirms a deeper breakdown, the bounce is likely to be short-lived.
Moving back above $80K would signal that bulls are regaining control.
Want any strategy ideas for trading this setup?
If you found this analysis helpful, hit the Like button and share your thoughts or questions in the comments below. Your feedback matters!
Thanks for your support!
DYOR. NFA

관련 발행물
면책사항
해당 정보와 게시물은 금융, 투자, 트레이딩 또는 기타 유형의 조언이나 권장 사항으로 간주되지 않으며, 트레이딩뷰에서 제공하거나 보증하는 것이 아닙니다. 자세한 내용은 이용 약관을 참조하세요.
관련 발행물
면책사항
해당 정보와 게시물은 금융, 투자, 트레이딩 또는 기타 유형의 조언이나 권장 사항으로 간주되지 않으며, 트레이딩뷰에서 제공하거나 보증하는 것이 아닙니다. 자세한 내용은 이용 약관을 참조하세요.