
Hello Traders,
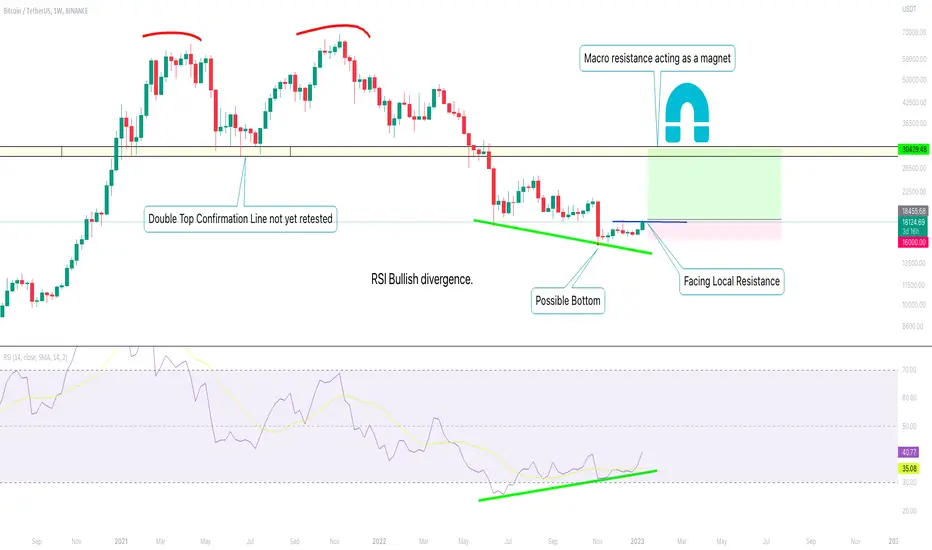
As you can see in the chart, at this moment we have Bitcoin facing local resistance, everybody is opening short positions here, so very likely to see a breakout.
You can clearly see an RSI Bullish Divergence in the Chart, this is a very strong signal that usually tells the end of a trend.
If we see a weekly close over 18000$ there is high probability for Bitcoin to reach Major Resistance that is the Neckline of the Double Top pattern printed in the All Time High 30000$.
This level acts very often as a magnet and there is usually high probability for the price to reach it again.
So if we see a weekly close over 18000$ Buy Setup with stop loss at 16800$ and with targets 21000$ 25000$ and 30000$.
I you agree with me a boost is much appreciated and If you have questions or you want to share your feedback I will be glad to answer in the comments.
As you can see in the chart, at this moment we have Bitcoin facing local resistance, everybody is opening short positions here, so very likely to see a breakout.
You can clearly see an RSI Bullish Divergence in the Chart, this is a very strong signal that usually tells the end of a trend.
If we see a weekly close over 18000$ there is high probability for Bitcoin to reach Major Resistance that is the Neckline of the Double Top pattern printed in the All Time High 30000$.
This level acts very often as a magnet and there is usually high probability for the price to reach it again.
So if we see a weekly close over 18000$ Buy Setup with stop loss at 16800$ and with targets 21000$ 25000$ and 30000$.
I you agree with me a boost is much appreciated and If you have questions or you want to share your feedback I will be glad to answer in the comments.
거래청산: 타겟 닿음
Price acting as initially planned.
면책사항
해당 정보와 게시물은 금융, 투자, 트레이딩 또는 기타 유형의 조언이나 권장 사항으로 간주되지 않으며, 트레이딩뷰에서 제공하거나 보증하는 것이 아닙니다. 자세한 내용은 이용 약관을 참조하세요.
면책사항
해당 정보와 게시물은 금융, 투자, 트레이딩 또는 기타 유형의 조언이나 권장 사항으로 간주되지 않으며, 트레이딩뷰에서 제공하거나 보증하는 것이 아닙니다. 자세한 내용은 이용 약관을 참조하세요.