
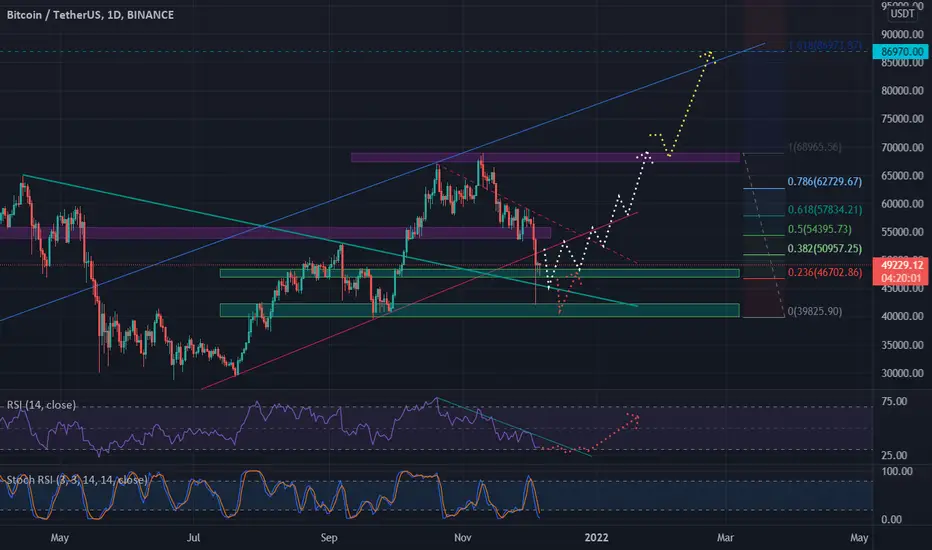
Bitcoin has almost lost most of its support in the recent downturn (25, 50, and 200-day moving averages)
And now he seems to be standing in the air. But an old trend line with good support at 46,000 has kept him. The trend line connects the previous April ceiling to the September 07 ceiling.
Now we have to see what happens ...
If good fundamentals and whales help, the composition of the chart can be seen in the figure above.
In my opinion, this strong trend line will prevent further decline and will throw it up.
Of course, we must remember that the next move of Bitcoin upwards is a mountain of obstacles and resistance, and generally a rocky path...
Another scenario in the time frame of the clock that you can see in the next post.
And now he seems to be standing in the air. But an old trend line with good support at 46,000 has kept him. The trend line connects the previous April ceiling to the September 07 ceiling.
Now we have to see what happens ...
If good fundamentals and whales help, the composition of the chart can be seen in the figure above.
In my opinion, this strong trend line will prevent further decline and will throw it up.
Of course, we must remember that the next move of Bitcoin upwards is a mountain of obstacles and resistance, and generally a rocky path...
Another scenario in the time frame of the clock that you can see in the next post.

관련 발행물
면책사항
해당 정보와 게시물은 금융, 투자, 트레이딩 또는 기타 유형의 조언이나 권장 사항으로 간주되지 않으며, 트레이딩뷰에서 제공하거나 보증하는 것이 아닙니다. 자세한 내용은 이용 약관을 참조하세요.
관련 발행물
면책사항
해당 정보와 게시물은 금융, 투자, 트레이딩 또는 기타 유형의 조언이나 권장 사항으로 간주되지 않으며, 트레이딩뷰에서 제공하거나 보증하는 것이 아닙니다. 자세한 내용은 이용 약관을 참조하세요.