
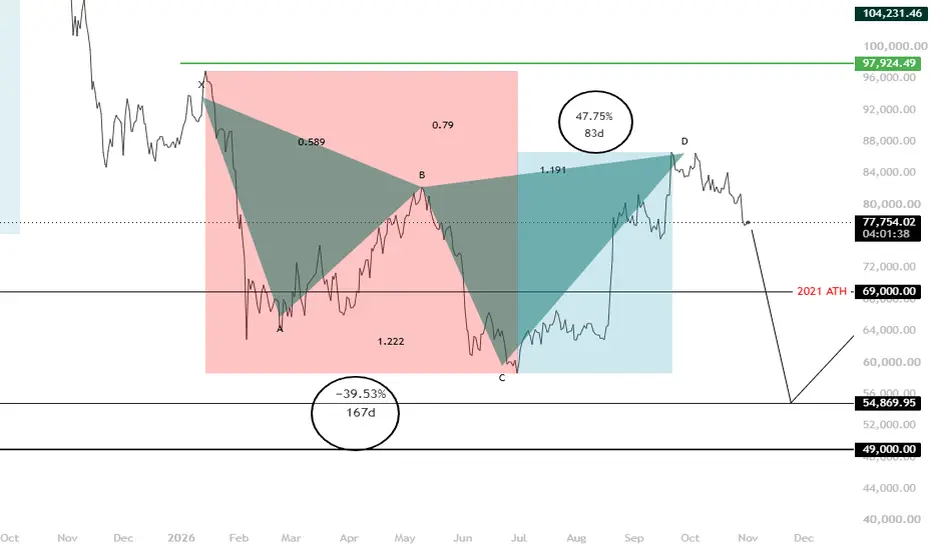
The harmonic pattern shown is a cypher on the Bitcoin weekly timeframe. The chart shown is a daily line chart set on closing price, this is intentional to show the harmony between the sell and buy side.
We have a drop from X to C taking 168 days. The rise in price took 84 days. I will leave you to do the math and work out the relationship.
I believe we see a bigger than expected drop to 54k give or take. I have seen lots of 74k predictions but due to many external factors a sharp drop to 54 seems more in order.
We have a drop from X to C taking 168 days. The rise in price took 84 days. I will leave you to do the math and work out the relationship.
I believe we see a bigger than expected drop to 54k give or take. I have seen lots of 74k predictions but due to many external factors a sharp drop to 54 seems more in order.

면책사항
해당 정보와 게시물은 금융, 투자, 트레이딩 또는 기타 유형의 조언이나 권장 사항으로 간주되지 않으며, 트레이딩뷰에서 제공하거나 보증하는 것이 아닙니다. 자세한 내용은 이용 약관을 참조하세요.
면책사항
해당 정보와 게시물은 금융, 투자, 트레이딩 또는 기타 유형의 조언이나 권장 사항으로 간주되지 않으며, 트레이딩뷰에서 제공하거나 보증하는 것이 아닙니다. 자세한 내용은 이용 약관을 참조하세요.