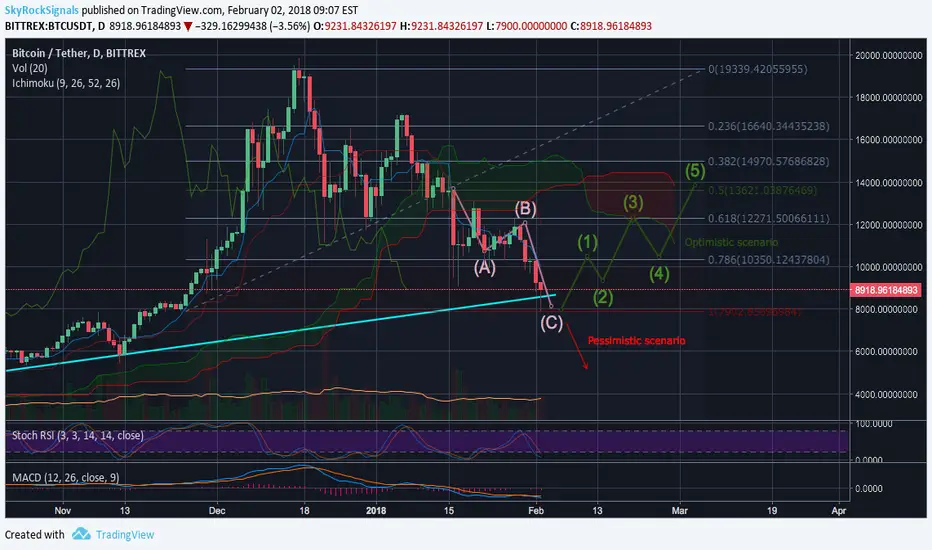
On the 1 day timeframe chart we can see that BTC is in a critical stage. The price touched Fib 1 support level and bounced back, now it is above the trend line again. MACD and RSI both indicate further growth, nevertheless indicator analysis never predicted BTC price movement. Whales understand that if the price goes below the trend line it will break support level and will go much lower. It is not in their interests so they should help it to consolidate and to go to the previous levels. Two possible scenarios are drawn on the chart. Which scenario is more likely to happen we will see in the end of this day. If trades close higher that it opened today then the optimistic scenario should take place otherwise we will see a greater correction wave.

면책사항
해당 정보와 게시물은 금융, 투자, 트레이딩 또는 기타 유형의 조언이나 권장 사항으로 간주되지 않으며, 트레이딩뷰에서 제공하거나 보증하는 것이 아닙니다. 자세한 내용은 이용 약관을 참조하세요.
면책사항
해당 정보와 게시물은 금융, 투자, 트레이딩 또는 기타 유형의 조언이나 권장 사항으로 간주되지 않으며, 트레이딩뷰에서 제공하거나 보증하는 것이 아닙니다. 자세한 내용은 이용 약관을 참조하세요.