 BTDR
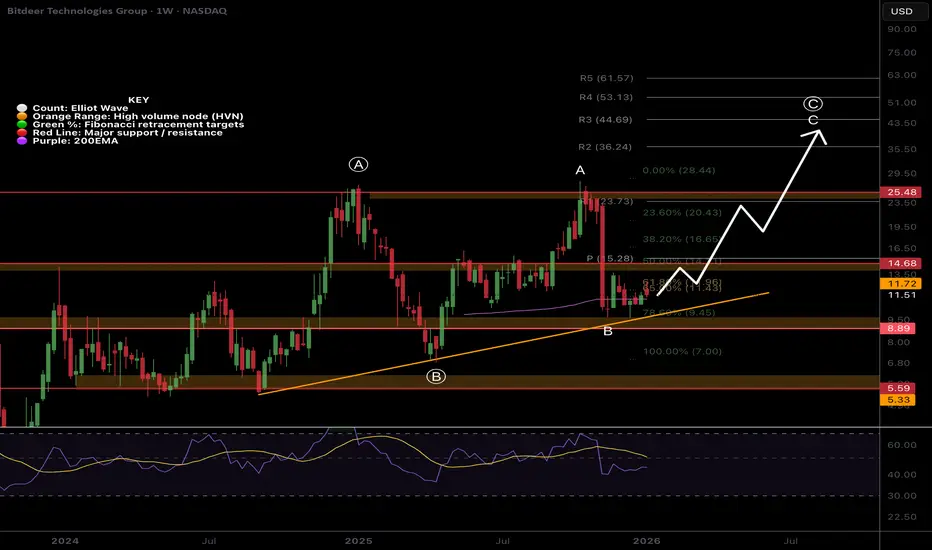
BTDR🎯 After a 500%+ rally to all-time high, BTDR gave back most of its gain in a single week, alongside Bitcoin, undoing all that hard work. Price is currently finding support just above the weekly 200EMA and low-cap golden pocket, 0.786 Fibonacci retracement. The macro structure is still bullish with a series of higher highs and higher lows. Wave C of (C) appears to be underway with a target of the R3 pivot at $44 once momentum to Bitcoin and AI returns. The weekly pivot is the next resistance, $15.
📈 Weekly RSI is below the EQ with plenty of room to fall until oversold, though historically it never quite reaches this low.
👉 Analysis is invalidated if price falls below wave (B), $6, and the structure will start to look bearish.
Safe trading

🎓 Behavioural Economist (PhD)
📈 Trader / Investor 15 years
👑 Unlock my trading plans: tradingblueprints.substack.com
🏆 Market Psychologist Newsletter: marketpsychologist.substack.com
📈 Trader / Investor 15 years
👑 Unlock my trading plans: tradingblueprints.substack.com
🏆 Market Psychologist Newsletter: marketpsychologist.substack.com
관련 발행물
면책사항
해당 정보와 게시물은 금융, 투자, 트레이딩 또는 기타 유형의 조언이나 권장 사항으로 간주되지 않으며, 트레이딩뷰에서 제공하거나 보증하는 것이 아닙니다. 자세한 내용은 이용 약관을 참조하세요.
🎓 Behavioural Economist (PhD)
📈 Trader / Investor 15 years
👑 Unlock my trading plans: tradingblueprints.substack.com
🏆 Market Psychologist Newsletter: marketpsychologist.substack.com
📈 Trader / Investor 15 years
👑 Unlock my trading plans: tradingblueprints.substack.com
🏆 Market Psychologist Newsletter: marketpsychologist.substack.com
관련 발행물
면책사항
해당 정보와 게시물은 금융, 투자, 트레이딩 또는 기타 유형의 조언이나 권장 사항으로 간주되지 않으며, 트레이딩뷰에서 제공하거나 보증하는 것이 아닙니다. 자세한 내용은 이용 약관을 참조하세요.